Regular daily update on BTC ta analysts opinions.

**My summary - short-term (next 24h) sentiment: neutral ** (last: slightly bullish)

- We probably going up either for a short term dead cat bounce or another impulse on a higher low.
Bearish scenario*:
- Price falls below 6'000 again and quickly gravitates towards 5'500 making a new low before turning to the upside.
- Alternate we recover one more time to a new lower high at around 6'500 and than drop below 6'000.
- Short term recovery from 5'500 staying under 6'000.
- After breaking 5'500 again a significant drop towards new lows in the range of 4'975 and 4'300.
Bull scenario*:
- We make a higher low.
- We break 6'839 followed by 7'050.
- Volume increases in spikes.
- We go towards the 50 week MA and break above it.
*scenarios based on daily-candles - so around 4-14 days timeframe. See also definition section
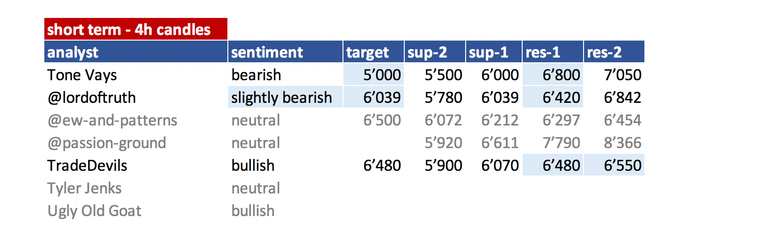
Summary of targets/support/resistance of TAs
Short-term overview
mid- and long-term overview
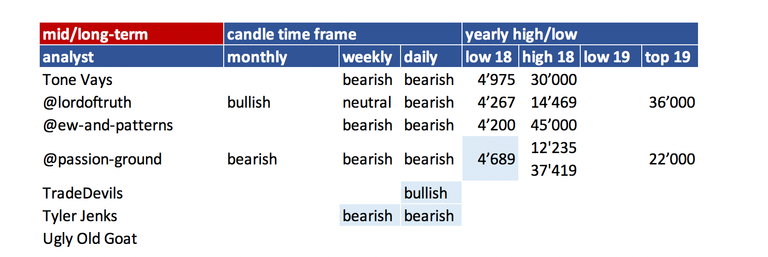
- please refer to definition section for time-horizon.
- you can easily spot which analyst did an update
(block writing - grey ones don't have an update today).
Their changes are in light blue.
Helpful statistics:
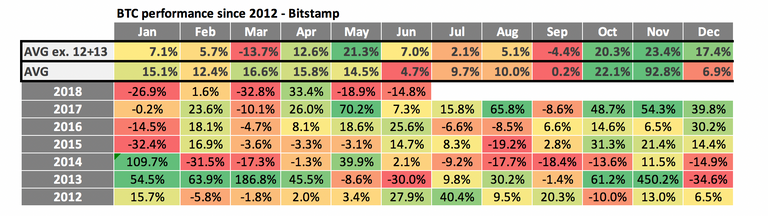
monthly performances
- Added 2012 + 2013 on request.
- As 2012 and 2013 the % move are gigantic I added two averages. One without 2012 + 2013.
- June performance was very weak. With -14.8% clearly below the average of the last years. With 2013 this is the only negative month at all.
- July is a mixed bag - 2 year positive performance and 2 year of negative performance. 2012 and 2013 were positive though.
- The average is positive with 2.1% but that is mainly due to the bull rund 2017. The average incl. 2012and 2013 is even more positive. That is mainly due to the 40%+ spike in 2012 so I wouldn't rely on that.
So just looking at this table we probably facing another negative month.
News about the blog
I added two analysts:
On youtube they have 30'000 follower. Running own trading academy. Will do a summary of those videos.@tradedevil: Very interesting TAs. Posting on youtube. Having also a steemit account and posting there but just links to their videos - so not too much added value that may also be the reason why they have not many followers here on steemt yet.Tyler Jenks: Is an money manager with 30+ years of experience. He is very strong focusing on a concept called hyperwave which explains how bubbles work. Also he uses Cosensio - a MA based system to determine where we at in the lifecycle of a market.
He has his own youtube channel (hyperwave) and does Trading Bitcoin videos often together with ToneVays. Being closely in discussion with Tone - he still has a unique view with a long term perspective. That is why I wanted to include him. He is not posting to often TA on his own. I include him more for a broader picture. Lets see if that can add value.UglyOldGoat: Very experienced trader. Very active on Bitmex. Has a relationship to Tone but a very independent opinion on the market. He posts on medium (if you like follow him there) not very regularly. So that is some kind of "nice to have". We see if that makes sense in terms of he frequency of posting.
Philakone - it seems he just abandoned steemit. On youtube he is focusing on other coins and on "scalping". That is not very well fitting into this summary. That is the reason why I decided to leave him out for now. Very unfortunate...!
Haejin: Bitcoin Live is where he is posting crypto analysis. That is the reason why I am not able to include him anymore. Also very unfortunate.
Analysts key statements:
Tone (bearish):
Short-term outlook:
- Weekly: Pulled up a little bit. Candle won't be a perfected 9. Next week is going to be interesting
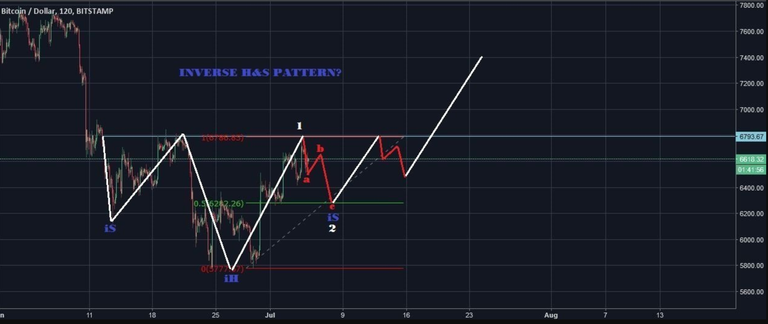
- Daily: Only on a 4. Might be 5 days bearish to go. As long as we not get above previous candle he doesn't see any bullishness. For the iSHS we need to go up to 6'800 and break through it. That would be a bullish sign which he is not expecting.
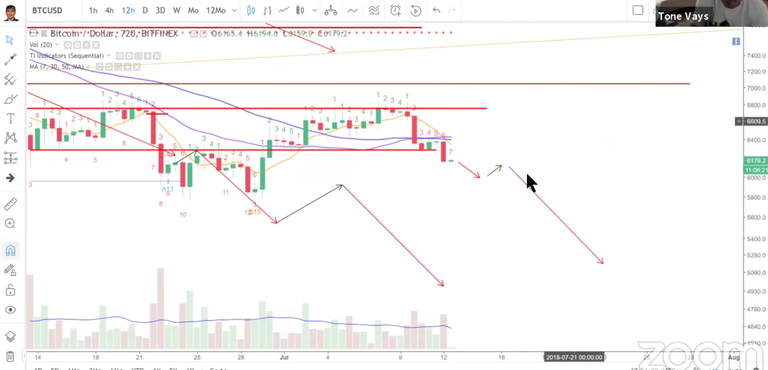
He expects the drop to 5'000 to be imminent.
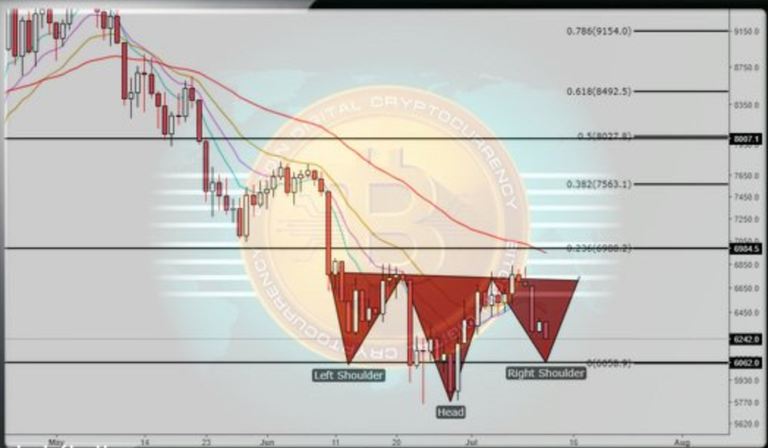
@lordoftruth (slightly bearish):
Bitcoin price, the last week, declined from Projected Resistance 6'842, stopped around 6'079, and due to the IHS Pattern, Bitcoin price showed upside bounce, that was limited to 6'340 area.
The reason why we believe the below Pattern Will Not Remain In Play as the bears most likely will be able to push the right shoulder below the neckline located at 6'039.
daily
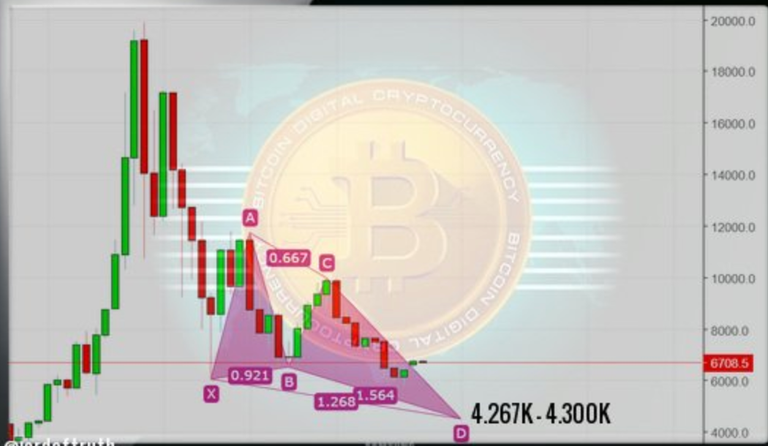
On Daily Chart we're still watching for AB=CD target also. As a lot of stops could be accumulated below 5'870 lows and once they will be triggered, the price could accelerate lower towards 5'500 followed by 4'300.
weekly
Stands the same and our major target of AB-CD Pattern around 4'300 still valid as long as the price below 6'842.
Todays trend is slightly bearish. Trading between 6'039 and 6'420.
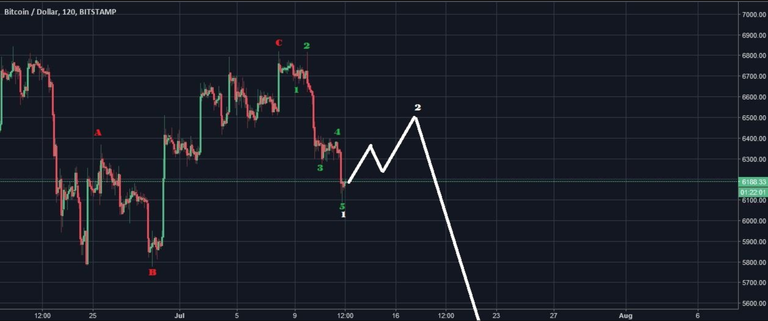
@ew-and-patterns (slightly bullish):

It all depends on the next move up - it looks like a 50/50 situation, but the bulls have a slight advantage on this one, because the 5 waves down ended at the .618 retracement (wave 2 target) and created a bull wick, which is exactly what the bulls wanted to see...
Bullish:
Bearish scenario: He sees a short term bounce up to 6'500 and than going down from there.
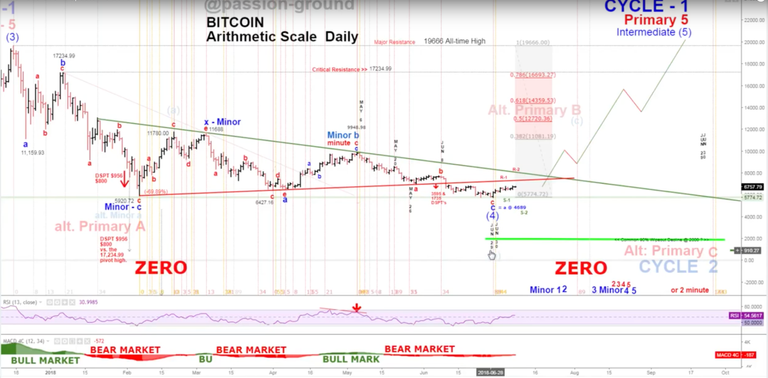
@passion-ground (neutral):
Still looking for clues as to the sustainability of the recent bear market lows. Thus far, basis the higher highs, and higher lows, we are the right track short-term.
He is still looking for clues how strong the bounce is. Higher highs and lower lows is a good start. But not yet we have broken through significant resistance levels. Next turn month is August, than January.
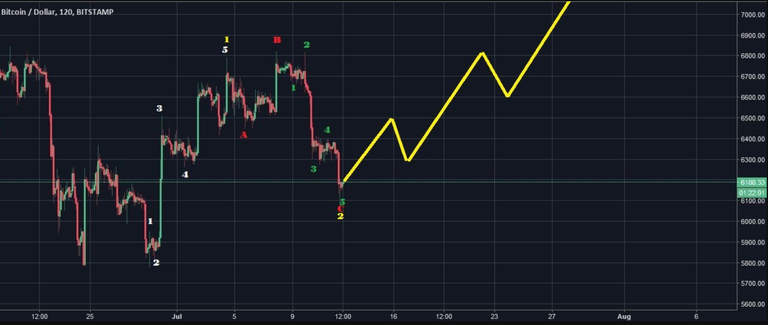
TradeDevils (bullish):
We have very spiky action followed by sideway moves (boxes). There we have significant support/resistances formed as the market is testing if those level are accepted. We need to get out of current consolidation with a significant spike.
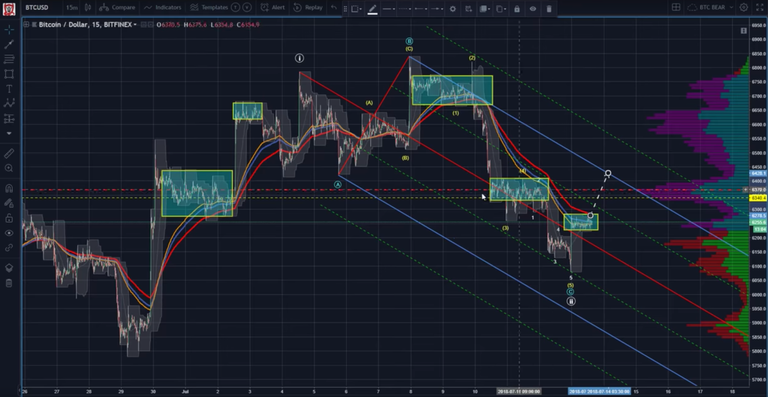
Bullish count is his primary:
He sees some divergence.
We came down to the golden zone which would be the perfect spot for wave 2 and going up from here to a wave 3 with a target of 7'050.
We need to get through 6'580 to get "algo" support. Therefore we need to see some real action breaking to the upside.
Looking for 5 waves up - higher lows.
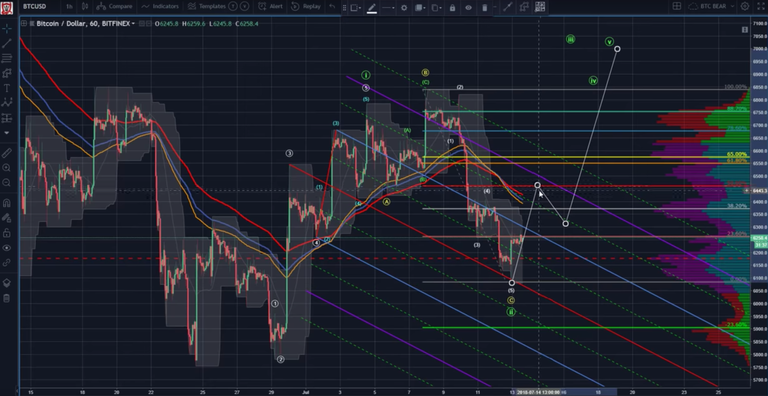
The bearish view could be that we go up to the 0.5 fib at 6'450. There we get turned around.
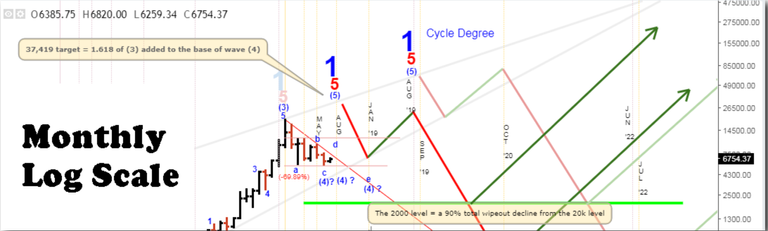
Tyler Jenks (neutral):
Short term he only positions himself if he sees a move of the market of 5% in either direction. So at the moment he is neutral but seeing us based on consensio in a bearish market (daily/weekly).
The 7 MA weekly is below the 30 MA weekly and both are declining. That is a bear market by definition for him. Also the 30 MA is accelerating to the downside making it likely to cross the 50 MA in the near future. That would be another bearish sign for him.
UglyOldGoat (bullish):
Beside all analysts who seem to lean to the downside Ugly has a different opinion. He see that fear is influencing the view - looking on the pure technicals he sees based on the TD system
- Quarterly 3 candle correction from quarterly 9
- Weekly buy signaled based on a 9
- 8 hour buy signaled based on a 9
- 4 hour buy signaled based on a 9
IT's time to pull the trigger
The basis, relative strength, the timing indicators all say it is time to pull the trigger and risk 1st and 2nd quarter lows. Yes, if we break it will be hard but that is fear. . . everything else says this is a low risk time and place to be a buyer.
Reference table
| analyst | latest content date | link to content for details |
|---|---|---|
| Tone Vays | 13. July | here |
| @lordoftruth | 14. July | here |
| @ew-and-patterns | 12. July | here |
| @passion-ground | 09. July | here |
| @tradedevil | 13. July | here |
| Tyler Jenks | 05. July | here |
| UglyOldGoat | 12. July | here |
Definition
- light blue highlighted = all content that changed since last update.
- sentiment = how in general the analysts see the current situation (bearish = lower prices more likely / bullish = higher prices more likely). The sentiment is based on 4hr, daily, weekly, monthly candle charts.
- The forecast time horizon of candles can be compared with approx. 4hr = 1-2 days; daily = 4-14 days; weekly = 4 - 14 weeks; monthly = 4 - 14 month.
- target = the next (short term) price target an analysts mentions. This might be next day or in a few days. It might be that an analyst is bullish but sees a short term pull-back so giving nevertheless a lower (short term) target.
- support/res(istance) = Most significant support or resistances mentioned by the analysts. If those are breached a significant move to the upside or downside is expected.
Educational links:
- Learning tradingFrom @ToneVays:
- Fibonacci RetracementFrom @lordoftruth:
- here. In addition he has an online course which you can find hereFrom @philakonecrypto: Like in every post you find links to his amazing educational videos. For example
- Elliott Wave Counting TutorialFrom @haejin:
*If you like me to add other analysts or add information please let me know in the comments.
WARNINGCONFIRMED SCAM!
DO NOT FOLLOW any instruction and DO NOT CLICK on any link in the comment! - The message you received from @sanjugangber is a
For more information about this scam, read this post:
https://steemit.com/steemit/@arcange/phishing-site-reported-steem-link-premium
If you find my work to protect you and the community valuable, please consider to upvote this warning or to vote for my witness.
Today i am feeling that i have understood bitcoin deeply!!!
Hi @famunger you are creating awesome post telling about bitcoin in details I think now bitcoin going up