Regular daily update on BTC ta analysts opinions.

**My summary - short-term sentiment: neutral ** (last: neutral)

- Critical support 7'000 - 7'200 bounced us.
- Still we have Tone and @lordoftruth seeing this move up short lived and lower lows coming soon.
- And on the other hand @haejin which is in favor of us going up from here (still looking for confirmation though). Also @ew-and-patterns thinks we are moving up.
- So again we are in uncertain territory. Is this a short live dead cat bounce or a turnaround point?
- If we don't break in this move 10'000 the likelihood of seeing new lows is increasing significantly. If we fall below 7'050 it will be very ugly.
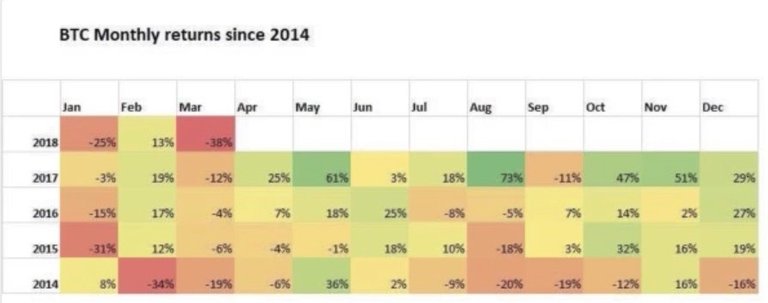
- May is usually a strong month. Lets see how it plays out in 2018.
News about the blog
I need to revise my 2018 long term table. I need to add a 2018 and 2019 target an be more precise on the sentiment here. Will do that after I am back in Switzerland.
We lunched the bounty project beta. If you are interested and you like to create a bounty on your own have a look at this post
Analysts key statements:
Tone:
- Weekly:
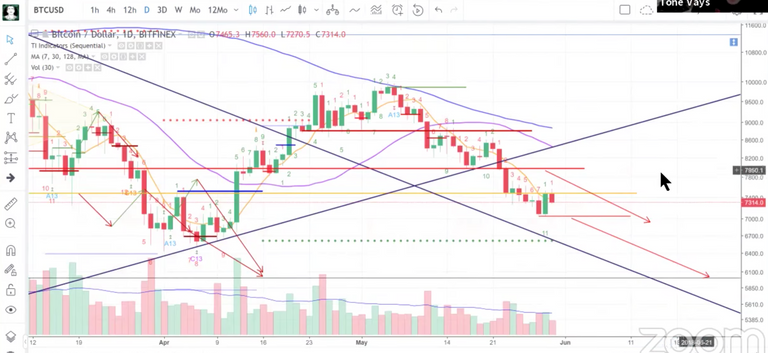
He compares this week with August 18th 2014. 50% of the gains yesterday are erased. He hopes for a bearish 9 to get a good buy signal and market reversal. - Daily: We reset the countdown to another nine. He sees that we fall and break to the upside a bit and than fall again. Reversal doesn't look strong. It might be that we move up to the top of the triangle. If low (at 7'050) is breached it gets very ugly very quickly.
@haejin:
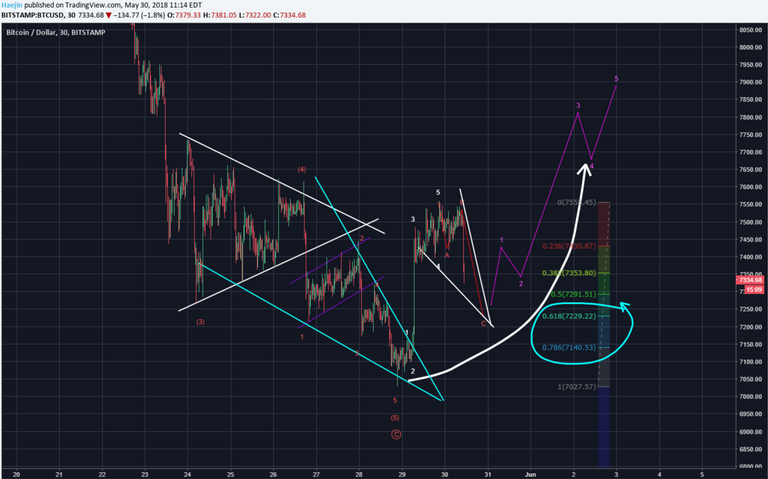
Bitcoin has completed the initial five wave up (white) since price broke out of the ending diagonal. A correction is expected now. The 0.618 and 0.786 levels are circled in blue since likely the correction will target those. From a pattern perspective, a downward wedge looks probable.
I've consistently stated that a real confirmation of a trend reversal is when there are two rounds of an impulse. We've just recently completed the first and after this very minor correction; a secound round of impulse as shown by the purple wave labels would be most ideal. The purple wave 5 should well exceed the 7'600 level.
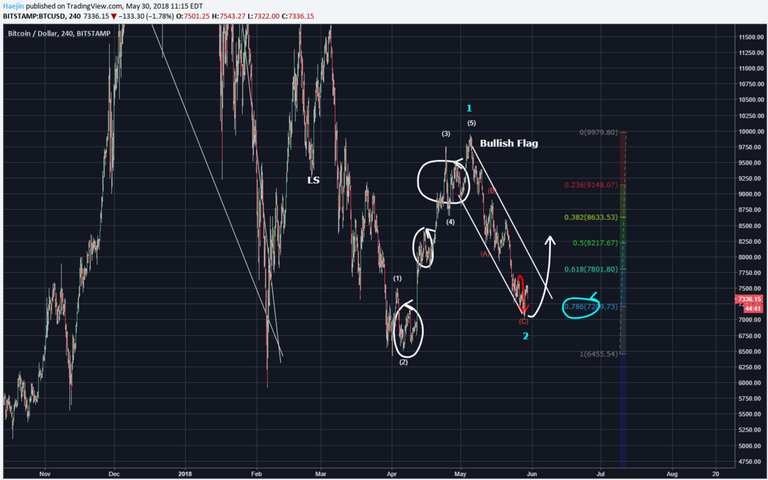
From the longer term perspective, the bull flag is still in play. The white arrow shows that the top white trendline needs to be breached to confirm the bull flag play. The level that needs to be breached is currently at around 7'600 or so; and the second round of impulse should enable a decisive breach.
@ew-and-patterns:

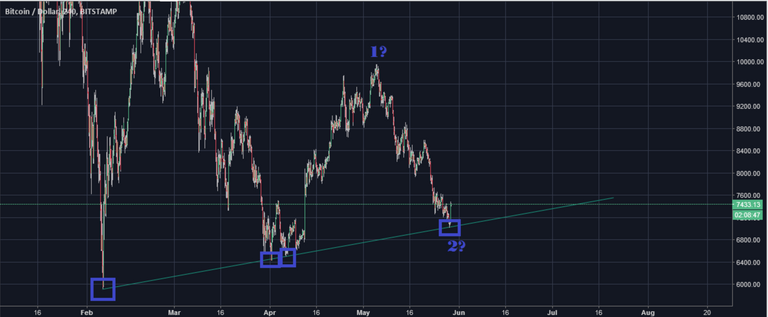
We bounce of a trendline which established itself as new trend line.
@lordoftruth:
Bitcoin price looks ready to resume the drop and a continuation of the slide could take it down below 6'519 to 78.6% around 6'300. While stronger selling pressure could move it to 100% extension at 5'947.
The 2 weekly bearish stop grabbers ( G seen on chart ) after breaking 7'614, suggest drop below 6'519, to test 5'878 reaching 4'300 area, where long term traders should wait this level as potential bullish reversal.
Technical indicators reflect some bearish exhaustion, but the bearish trend remain valid conditioned by stability below 7'910 and the most important level at 8'643.
Todays trend is bearish. Trading between 6'915 and 7'910.
@philakonesteemit:

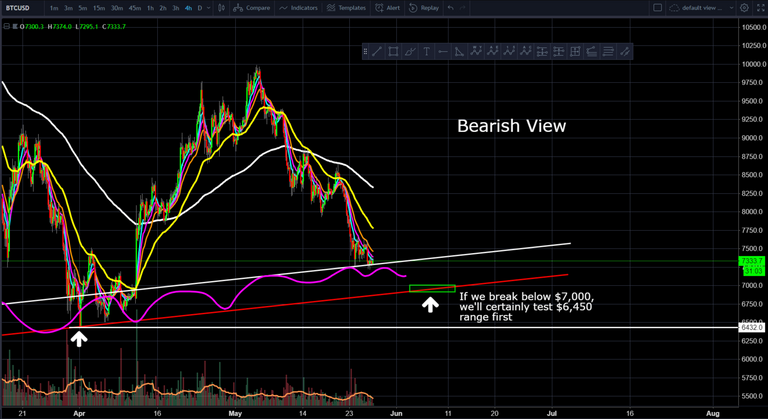
The bearish view: A break below 7'200 range, we'll certainly test 7'000, where if that doesn't hold, 6'450 is the next range of support.
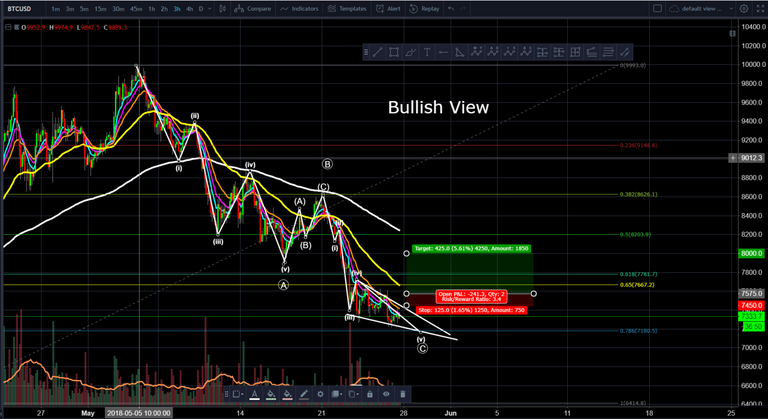
The bullish view: A break above 7'650 range and we can test the 8'000 range first.
@passion-ground:

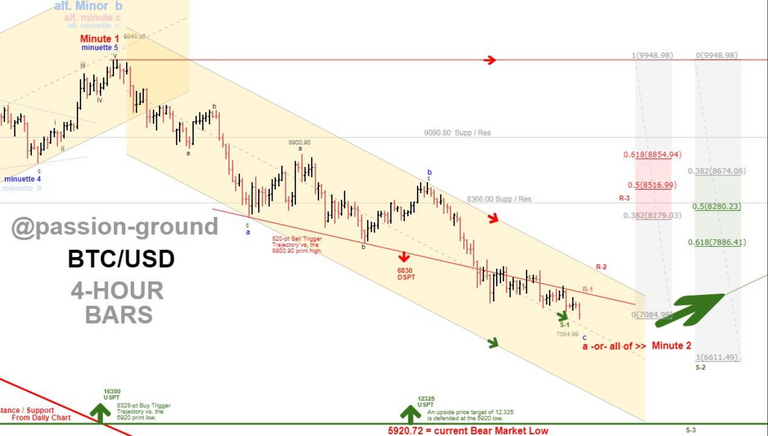
At present, BTC can’t get out of its own way. So, where is the bottom? He sees 6'830 as a possible bottom.
Summary of targets/support/resistance


Reference table
| analyst | latest content date | link to content for details |
|---|---|---|
| Tone Vays | 30. May | here |
| @haejin | 30. May | here |
| @ew-and-patterns | 29. May | here |
| @lordoftruth | 31. May | here |
| @philakonesteemit | 28. May | here |
| @passion-ground | 29. May | here |
Definition
- light blue highlighted = all content that changed since last update.
- sentiment = how in general the analysts see the current situation (bearish = lower prices more likely / bullish = higher prices more likely)
- target = the next (short term) price target an analysts mentions. This might be next day or in a few days. It might be that an analyst is bullish but sees a short term pull-back so giving nevertheless a lower (short term) target.
- support/res(istance) = Most significant support or resistances mentioned by the analysts. If those are breached a significant move to the upside or downside is expected.
- bottom = -> now renamed and moved to long term table. Low 2018
- low/top 2018 = what is the low or the top expected for 2018?
Further links for educational purposes:
- Learning tradingFrom @ToneVays:
- hereFrom @philakonecrypto: Like in every post you find links to his amazing educational videos. For example
- Fibonacci RetracementFrom @lordoftruth:
- Elliott Wave Counting TutorialFrom @haejin:
*If you like me to add other analysts or add information please let me know in the comments.
Hello my dear i hope that you're good and everything goes fine with you. By the way this is a humble gift for you hope you accept it if you're interested if course. 😛
https://steemit.com/@soufianechakrouf/a-gift-for-famunger
Thank you for your consistency in producing quality summaries famunger. We just uploaded a new BTC Technical Analysts Daily Summary from our side. Go check it out and give us a vote please.
https://steemit.com/bitcoin/@btc-hunter/bitcoin-technical-analysis-analysts-opinions-may-31st …
Hello, there thank you for your summary. Do you mind if I translate your post to the Korean Language? Please let me know, I know a lot of Koreans will love to read a daily update on BTC. Cheers!
Mid-term forecast..