Trendline Time For Bitcoin
Happy Monday to you all! Today is a special day for the #1 cryptocurrency, with Bitcoin currently approaching its downtrend line.
I'm going to look at the daily charts today, to get a more longer-term look at the top 10 currencies to see what's happening.
Let's get into it!
Bitcoin
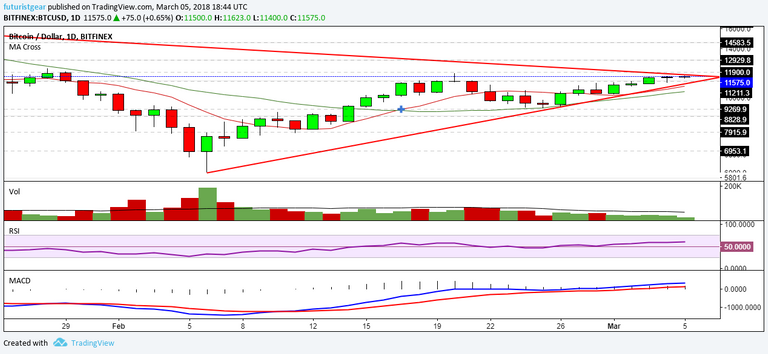
BTC/USD Daily Charthttps://www.tradingview.com/x/NplS57RT/
Here's that downtrend line I talked about above, and it could be tested today if the volume picks up. If not? We might have to wait and see what happens tomorrow.
The indicators are all showing as bullish right now:
- RSI is above 50 indicating good strength
- The MACD remains bullish, and...
- The MA cross remains on the buying side.
As mentioned, we need some volume which is a little bit below average at the moment. But the next major hurdles at the downtrend line and the $11,900 level could be breached if the bulls remain in charge.
Ethereum
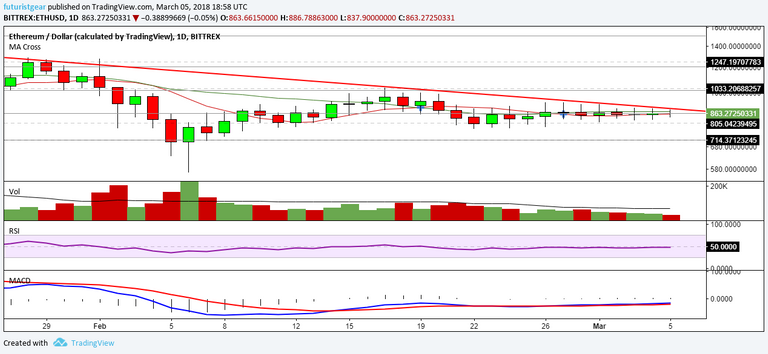
ETH/USD Daily Charthttps://www.tradingview.com/x/oGdYIo6x/
Ethereum looks extremely neutral on the daily chart, and it is getting very close to its downtrend line much like Bitcoin. If it can gather strength and some more volume, we could see a similar test of that line happening in the ETH/USD pairing too.
The MA cross is also becoming extremely compressed here, which is quite often a sign of a rally coming soon. (Which could go either way).
And, there is also still the triangle in play on the shorter term time-frame too...
Ripple
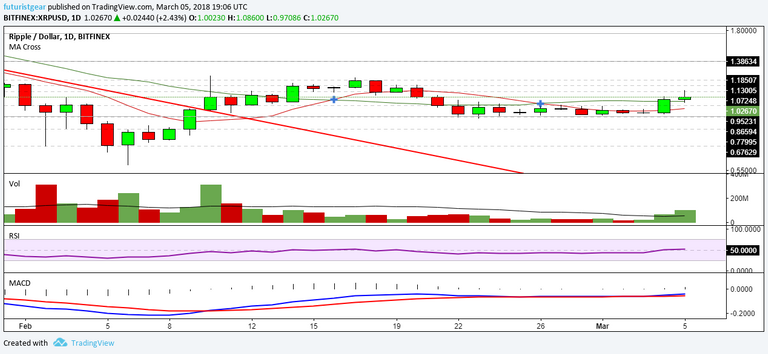
XRP/USD Daily Charthttps://www.tradingview.com/x/kkZltTeF/
Ripple is today's biggest top ten gainer, but it still looks surprisingly neutral on the daily charts despite that.
- The RSI is only just above the 50 level
- The MACD is borderline bullish
- MA Cross hasn't given a buy signal yet
According to what I've read so far today, the breakout may have been fueled by Coinbase listing rumors (unsubstantiated ones as far as I know), and it seems that the $1.13 resistance level has been too strong for XRP to overcome for now.
Bitcoin Cash
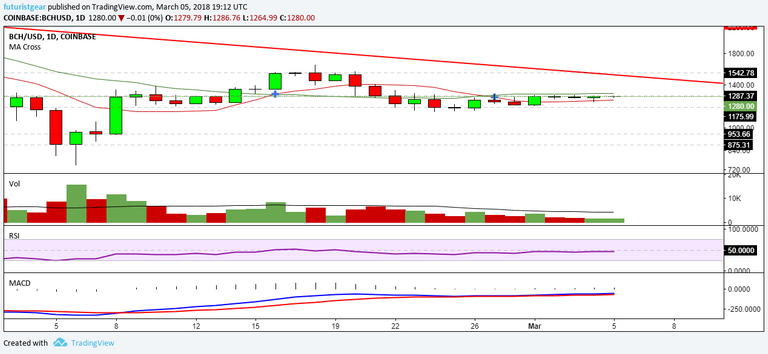
BCH/USD Daily Charthttps://www.tradingview.com/x/Y4BUiW0Y/
Also looking super neutral on the daily charts is Bitcoin Cash, with that $1280-ish level still providing resistance. Volume remains well below average here also, and more will be needed if it is going to break the downtrend.
Litecoin
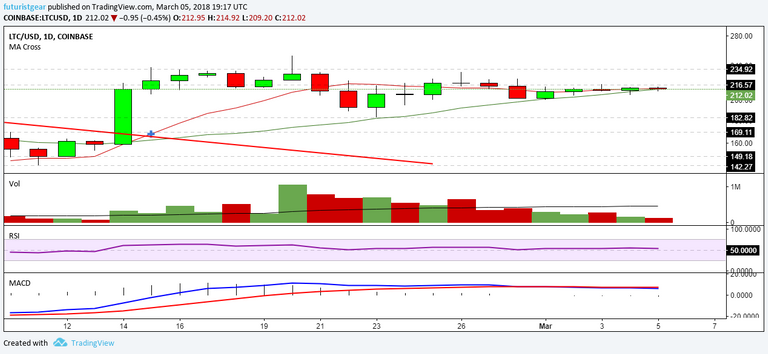
LTC/USD Daily Charthttps://www.tradingview.com/x/w2cxPEKX/
Litecoin maintains good strength on the daily chart, but is on the bearish side on the MACD currently which be indicating further sideways action over the longer term time frame.
For more in depth LTC analysis, you may want to see this post.
Cardano
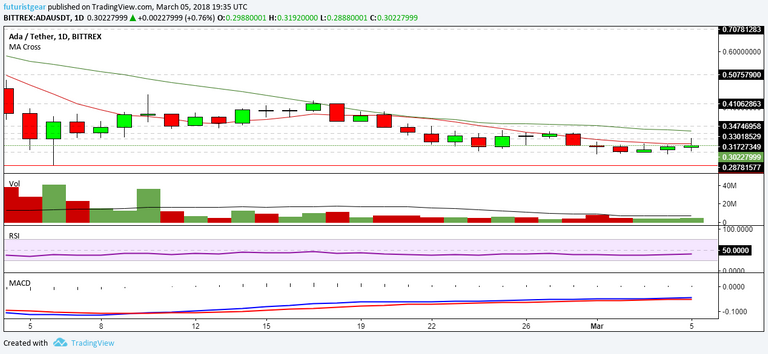
ADA/USD Daily Charthttps://www.tradingview.com/x/E2It27qw/
ADA has stolen 6th place back from NEO for the moment, and we can see a bullish divergence on the MACD, with the MACD gaining strength while the price continued to slide.
It still looks a little weak on the RSI, but Cardano could have reached its bottom at around $0.28 support, and it is facing resistance at 31c and 33c if it can gain more bullish sentiment.
NEO
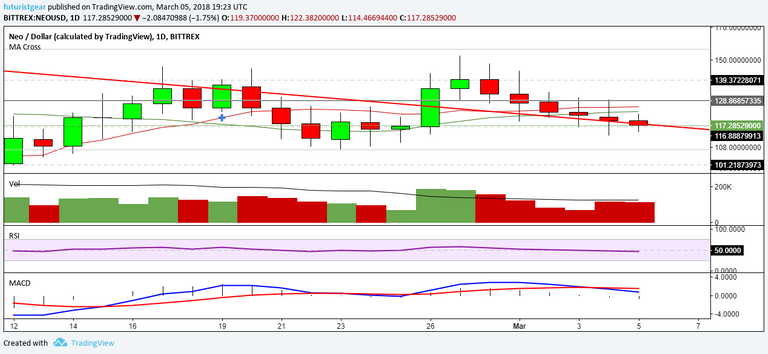
NEO/USD Daily Charthttps://www.tradingview.com/x/mBYUeUrL/
NEO continues to slide, and it is now on the bearish side on both the MACD and RSI (although only slightly weak on the RSI).
NEO is currently making use of the prior downtrend line and the $116 price level for support. If it remains bearish and/or continues to slide, then further support can be found at $108.
Stellar

XLM/USD Daily Charthttps://www.tradingview.com/x/V7qBumwS/
Stellar looks fairly similar to ADA, but it is showing a little more strength right now. Lumens attemted to break the downtrend line earlier, but it hasn't quite managed to get above it on the daily chart yet.
There is also a resistance area at about $0.37 that seems to be keeping the price down currently, but if the MACD remains bullish and some more strength can be found; then that downtrend line may be tested again very soon.
Monero
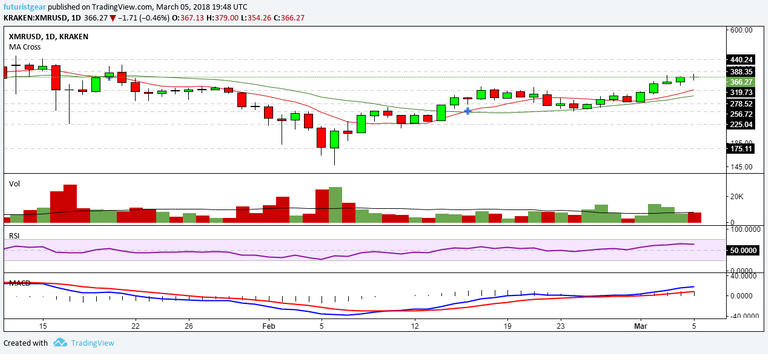
XMR/USD Daily Charthttps://www.tradingview.com/x/HZIxHIZt/
Monero has been on a nice rally recently after breaching through resistance at about $319, and it remains bullish on the daily chart currently.
- RSI is well above 50
- The MACD is bullish
- MA cross remains on the buyers side.
If it remains bullish moving forward, the next key level to watch is resistance at $388 and then the $440 level.
If the bears were to return, looks for that $319 level for support, with more at the $280-ish level, which seems unlikely to be needed as things stand.
EOS
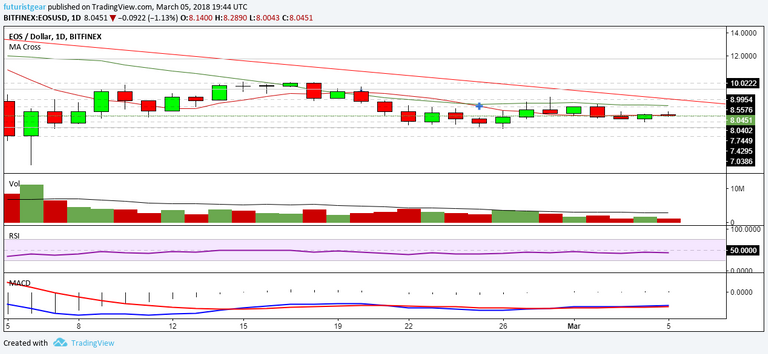
EOS/USD Daily Charthttps://www.tradingview.com/x/D46mTY90/
EOS looks much the same as ETH and BCH: super neutral. It is back above the $8 support/resistance level once again, but the indicators seem to be pointing to more sideways action right now. That said, there is some bullish divergence here too, with the MACD gaining in height while the price remains fairly steady.
Summary
There are a few clear winners right now in XRP and XMR, with 3 coins looking very neutral in ETH, BCH, and EOS.
A few MACD divergences are also present, which could indicate a bull-run quietly being built under the surface.
Any thoughts on the above? Did I miss anything? (It happens!) Please let me know below!
Thanks for viewing!
Want more technical analysis and crypto related posts? See also: @toofasteddie, @gazur, @ew-and-patterns, @pawsdog, @cryptomagic, @exxodus, @beiker, @lordoftruth, @masterthematrix, @cryptoheads, @tombort, @maarnio, @steemaze & @briggsy
Not intended as investment, financial, or trading advice. For entertainment purposes only.