Episode 17 - I Think...
Haven't done an episode of Charting The Top 10 for a little while now, so let's see what all the big boys are doing.
I'm splitting this episode into 2 parts, because it is going to be a little bigger than usual. I'll try to keep it as short as I can though so you don't get bored with my ramblings.
Let's get into it!
Bitcoin
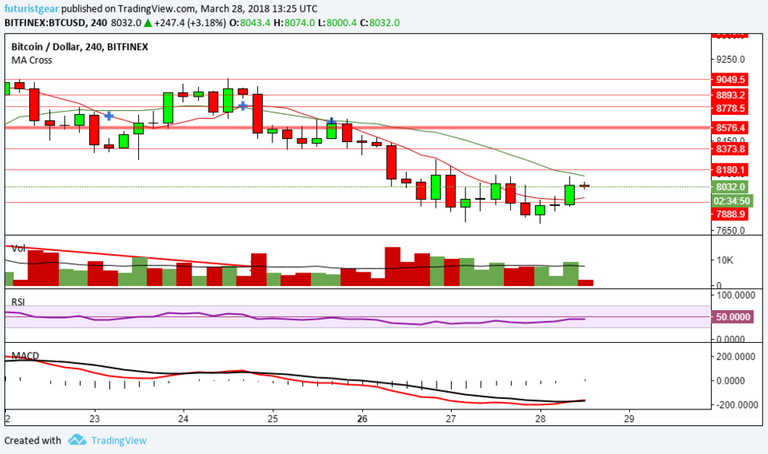
4 Hour Charthttps://www.tradingview.com/x/D7xrujZx/
The 4 hour chart above is providing some bullish looking indicators currently. With a very short term uptrend currently building, and the MACD switching to the bullish side too.
But...
Daily Charthttps://www.tradingview.com/x/0aGPWYIL/
The daily chart is still on the bearish to neutral side despite today's modest gain, with the RSI weak and the MACD in the bears neck of the woods.
The Weekly remains bearish too, as you can see here:
Weekly Charthttps://www.tradingview.com/x/oqAWjMEY/
Resistance is ahead for Bitcoin at $8180, with support at $7900 and $7500.
Ethereum
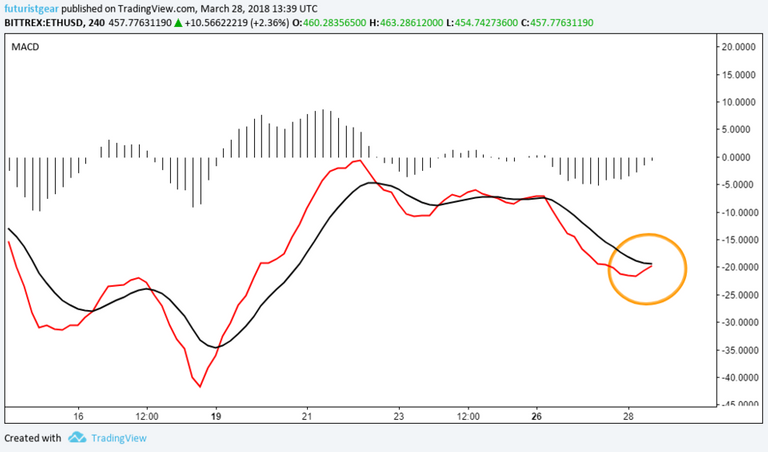
4 Hour ETH/USD MACDhttps://www.tradingview.com/x/H3CgbwzF/
Ethereum looks much the same as it did when I charted it the other day, but the 4 hour chart could provide some short term bullishness if that MACD can turn bullish.
ETH still looks oversold on the daily chart too, so there is still the possibility of a bounce from that too, even if the weekly chart still looks bearish right now.
Ripple
XRP 4 Hour Charthttps://www.tradingview.com/x/xV2rLq6L/
Ripple has had a bullish cross on the 4 hour MACD, but the RSI remains weak currently as it hovers around the 58 cent support/resistance level.
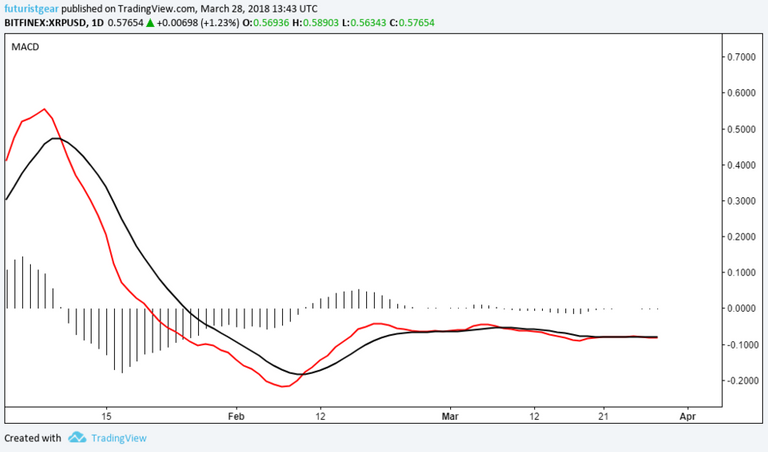
Daily XRP MACDhttps://www.tradingview.com/x/m3WBBQyZ/
On the Daily charts for XRP, we see the above. A flat/super neutral looking MACD.
There is also a weak RSI on the daily charts too, but unlike ETH; it isn't oversold (yet?).
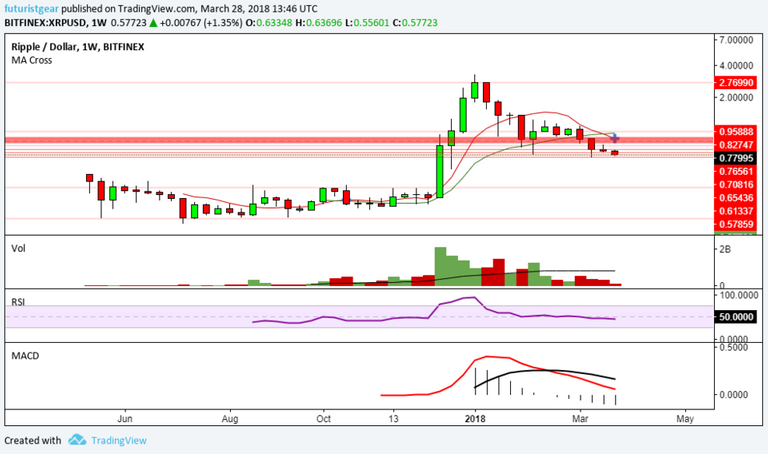
Weekly Charthttps://www.tradingview.com/x/r0WIkm7l/
We can also see on the weekly chart that the big picture remains bearish here too, with the RSI falling below the 50 level, and the MACD remaining in the bears favor.
Key support for XRP is at 54c, with resistance ahead at 60c if it can gain strength and volume.
Bitcoin Cash
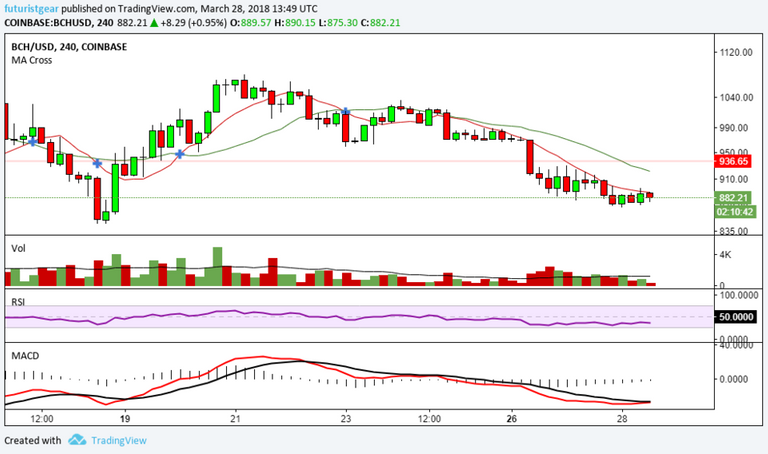
4 Hour Charthttps://www.tradingview.com/x/KYbd6gET/
BCH looks similar to ETH right now on the 4 hour time-frame, so if the MACD turning bullish is enough to spark some bullish action, then we could see some short term price rises here.
But...
Daily Charthttps://www.tradingview.com/x/vsnkzzyf/
The Daily chart looks more like XRP and is neutral on the MACD but clearly weak on the RSI.
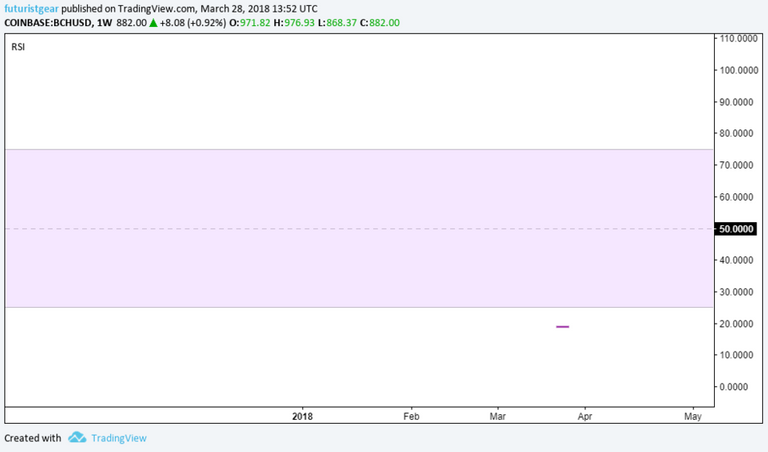
There isn't enough data on the weekly chart to go on, but this little blip on the weekly RSI:
Could be suggesting that it is oversold. But since it mainly follows its big brother, that might not matter. But, according to Blocktivity the number of transactions on that network is up.
Lastly!
Litecoin
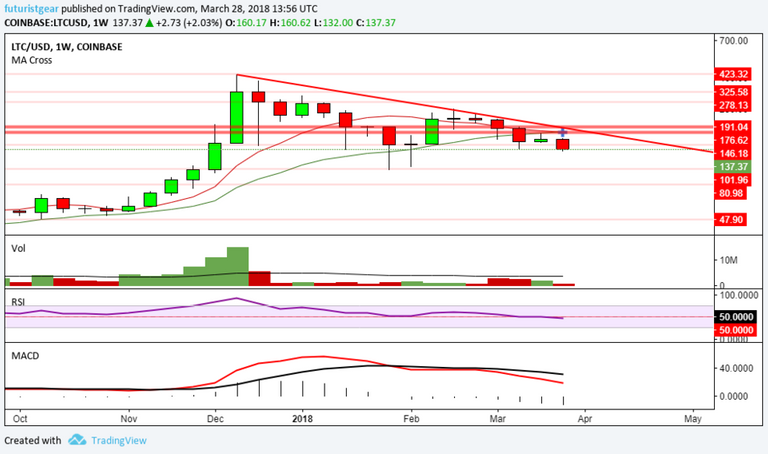
Weekly LTC Charthttps://www.tradingview.com/x/WyNNbgNx/
Litecoin is likely suffering from a combination of Bitcoin still correcting, itself still correcting, and that increase in the number of BCH transactions. Add all that to the fact that Litepay has gone up in smoke and thing are looking pretty bleak for my old favorite coin.
Despite all of that, the 4 hour chart looks similar to that of ETH too, so there might be a little rally on the cards soon despite the longer term picture remaining bearish.
There seems to be key support for LTC at $132 with resistance ahead at $140.
Top 5 Summary
It's still not looking to great for the top 5 from my technical perspective, but the price levels remaining higher than the prior lows could be a positive sign.
I'm still treading with caution personally, but what about you? Let me know below!
Thanks for viewing!
Part 2 later, hopefully! :-P
Want more technical analysis and crypto related posts? See also: @toofasteddie, @gazur, @ew-and-patterns, @pawsdog, @cryptomagic, @exxodus, @beiker, @lordoftruth, @masterthematrix, @cryptoheads, @tombort, @maarnio, @steemaze & @briggsy
Not intended as investment, financial, or trading advice. For entertainment purposes only.
