South Korea News Causes Sell Off
News from South Korea that cryptocurrency exchanges would be banned sent prices tumbling a few hours ago, but we seem to have recovered at least some of those losses already.
This article from Coin Desk does a very good of explaining the situation.
It seems that the panic may have been overblown (as usual), but I guess we will have to wait and see!
In the meantime, let's see how the sell off has effected the charts:
Bitcoin
Bitcoin had broken above the short term down trend line that was forcing BTC/USD prices lower yesterday, but the Korea news has forced Bitcoin prices back under it:

RSI and MACD indicators are still showing us a bearish reading too.
If Bitcoin is to begin a new rally higher, we need to see the MACD crossing back towards bullish, the strength of the RSI improve, and that downtrend line to be broken once again!
Ethereum
Ethereum was largely unaffected by the coin market cap sell off just the other day, and had been seen to be putting in new all-time highs recently, with prices just about breaching the $1400 level.
But it now seems as though ETH may be enterring a corrective period.

The MACD crossed to a bearish reading, and the RSI has also fallen below the 50 level, indicating some weakness.
On the plus side, the short term uptrend is still intact, and that will be a key level to watch if prices do fall more for Ethereum.
Litecoin
Litecoin did eventually follow Bitcoin in breaking its downtrend line, but the crash has also pushed LTC back below it once more, and the correlation between BTC and LTC we have been seeing lately continues.

We are once again seeing very similar readings on the RSI and MACD here, with both looking bearish right now.
And lastly...
Dash
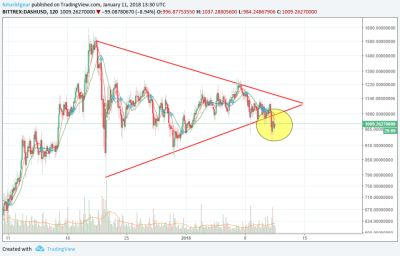
The triangle/compression pattern in the DASH/USD market has needed a post-crash adjustment.
Here is how I had it drawn yesterday:

And here's how it looks now:

Crashes often violate any patterns you may have had drawn, but sometimes they just need tweaking.
What we're also seeing with DASH is very similar reading to LTC and BTC, both the RSI and MACD are on the bearish side, and we need to see a change there to signal some higher price action.
The top of the triangle will need to be broken too!
That's all for now, my next post will be for STEEM and SBDs. :-)
Thanks for looking!
For more awesome technical analysis and crypto related posts, see also: @toofasteddie, @gazur, @ew-and-patterns, @pawsdog, @cryptomagic, @exxodus, @beiker, @allthereisislove, @lordoftruth, @masterthematrix, @cryptoheads, @tombort, and @maarnio
Not investment, financial, or trading advice & purely for entertainment purposes.
2 hour charts used in this post.
yes, the tide seems to be going out and bringing most of the boats lower as it goes out. The reactions to negative news seem to be short-lived in the past and seem to serve to establish a baseline that prices then move up from. thanks for the charts and your take on them @futuristgear
That's a great point about establishing a baseline, it seems that's exactly what has happened. We'll have to see what happens though.
No problem @watertoncafe! Thank you for your comment and the upvote. :-)
if the past is any indication then the knee jerk reaction to the news will pass and the coins will resume moving upwards again. Mot of the main ones that is, I'm not so sure about Steem though. For the next while Steem may drift lower and lower.
It seems exactly that is happening now, most of the coins seem to be showing green today.
I'll have a look at STEEM and SBD today for sure! I was meant to do it yesterday but got carried away. :-)
love all that Green! even Steem is green :)
Oh yeah! :-D
Here's the new post for STEEM and SBD in case you missed it: https://steemit.com/steemit/@futuristgear/steem-and-sbd-update-things-are-looking-good
good post, thanks for the link. I checked it out, looks good.
thanks for good information