If you follow Technical Analysis (TA) on Bitcoin (BTC) and other cryptocurrencies you might have noticed that some are claiming that the price of bitcoin is falling on falling volume. The theory going that as less people trade, there's less demand, and the price falls.
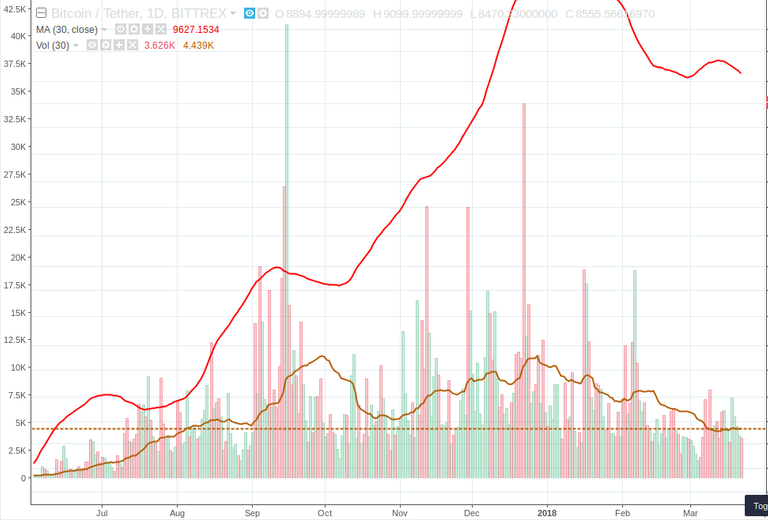
You might also have noticed this yourself if looking at your own exchange, if you're using Bittrex for example. On Bittrex the volume 30 day moving average of BTCUSDT (USD Tether per BTC) has been falling since December 27 2017 and is now on the same level as August 4 2017 when the price of BTC was 2846 USDT!

BTCUSDT volume on Bittrex from approximately June 2017 until March 22 2018. Made with Tradingview. Red line is 30 day moving average for price, brown line is 30 day moving average volume, and the dashed bar is the moving average at the moment.
There's a number of problems with just looking at one pair on your own exchange, or one of the biggest ones for that matter though:
- Volume is spread on a number of exchanges and is moving between exhanges.
- New and popular exchanges are established all the time.
- Volume is spread on many other trading pairs, for example BTCETH, and ether can also be bought for fiat.
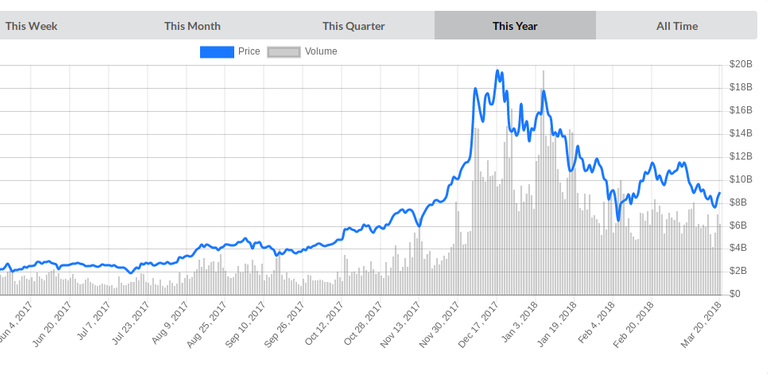
Thus, if we look at combined volume for (almost) all exchanges at for instance livecoinwatch.com we see another picture. Daily volume hasn't been below 4 billion since november 26 2017, and is likely to stay above 6 billion within the next few months. Volume has certainly fallen since ATH, but you don't need to go further back than end november and it has gone "steadily" up since then.

Bitcoin price and volume last 12 months from livecoinwatch.com
However, thers's a problem with this analysis also. Trading volume on livecoinwatch and coinmarketcap rely on information from the exchanges, and as recently documented by Sylvain Ribes, such information cannot always be trusted. He estimated that 4 billion USD daily cryptocurrency volume is fabricated, and neither livecoinwatch nor coinmarketcap seems to have addressed the problem.
Where does that leave us? Without correction from the data aggregators it is hard to say know at what time how much fabricated data was introduced, and thus what the real trend is.
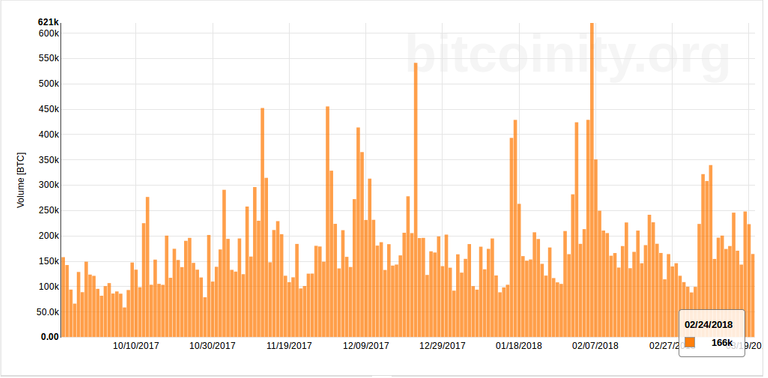
bitcoinity.org is a bitcoin trading data aggregator which does not include the 4 billion obviously fabricated volume (simply because they haven't included many exchanges at all). Here we still see a similar picture to the one above, albeit with BTC as base currency, or even with trades per minute; that the minimum/base combined volume is climbing steadily from 50k to 100k per day.

Daily BTC trading volume from data.bitcoinity.org 6 months back. Denominated in BTC.
I recommend taking a look at the different statistics on data.bitcoinity.org, for example the exchanges list gives quite another rank than if you only look at volume, by comparing the order books (explanation here).
Conclusion? I does not look like the price of BTC from all time high (ATH) has really been falling on falling volume in a 3–6 months perspective, if so we should have seen a consistent decrease of volume since ATH similar to the increase before. However, the volume might not be very much higher either, but quite probably "different". In the longterm, volume seems to be looking good for BTC.
Congratulations @guttormf! You have completed some achievement on Steemit and have been rewarded with new badge(s) :
Click on any badge to view your own Board of Honor on SteemitBoard.
To support your work, I also upvoted your post!
For more information about SteemitBoard, click here
If you no longer want to receive notifications, reply to this comment with the word
STOP