
SUMMARY
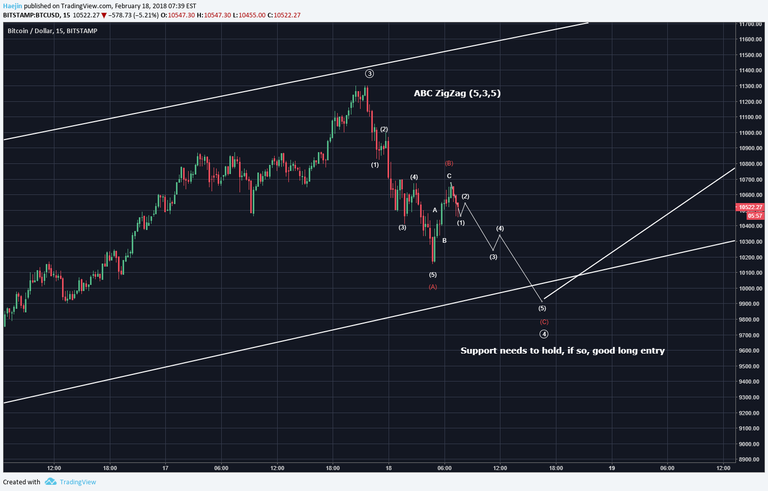
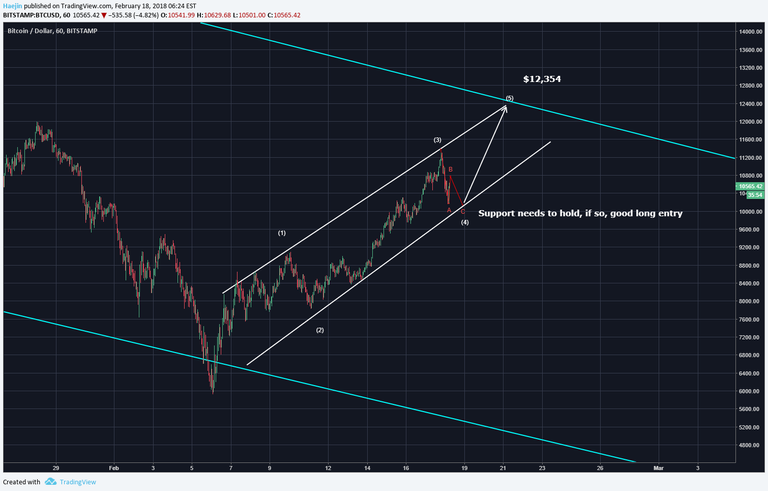
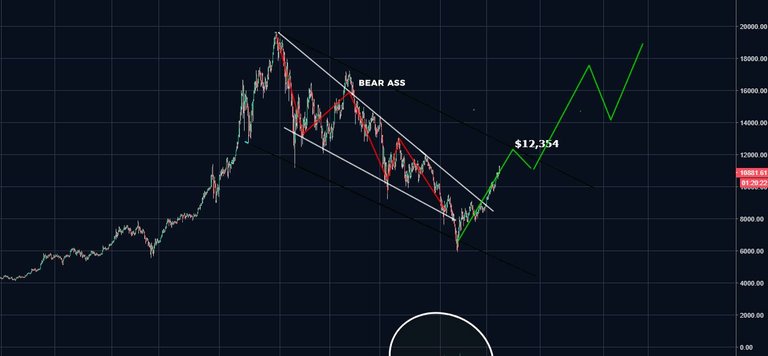
Bitcoin (BTC) overnight price action has shown that the corrective pathway is likely an ABC zigzag (5,3,5) correction. Primary count shows that wave a,b are likely done and c down is in progress. The bottom white support line must not be decisively breached. A temporary piercing is expected and favorable as then it would be a bull wick; but the breach can't be decisive.
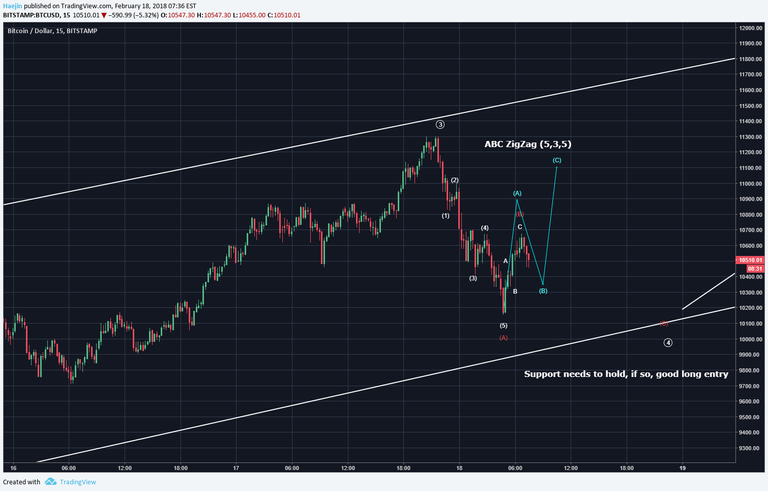
The alternate pathway for the correction is shown below in blue abc waves. It only means a longer time frame but same destination.
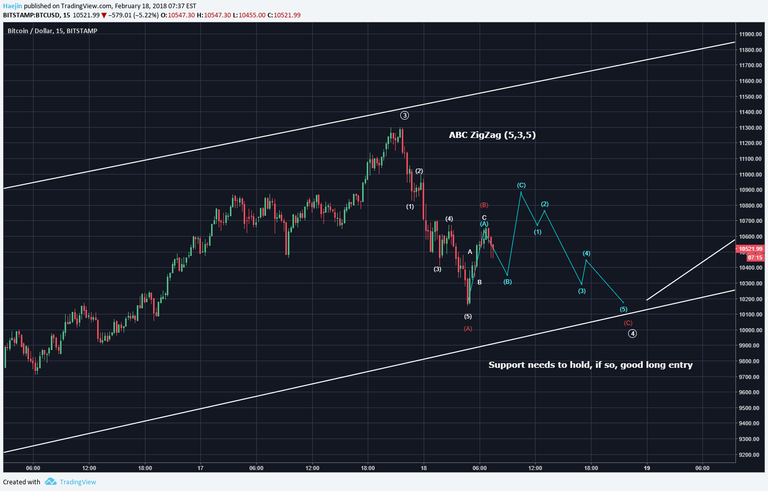
The subsequent five waves down for the blue c wave would provide the abc bottom and marking of wave 4. Again, the bottom white line support needs to hold.
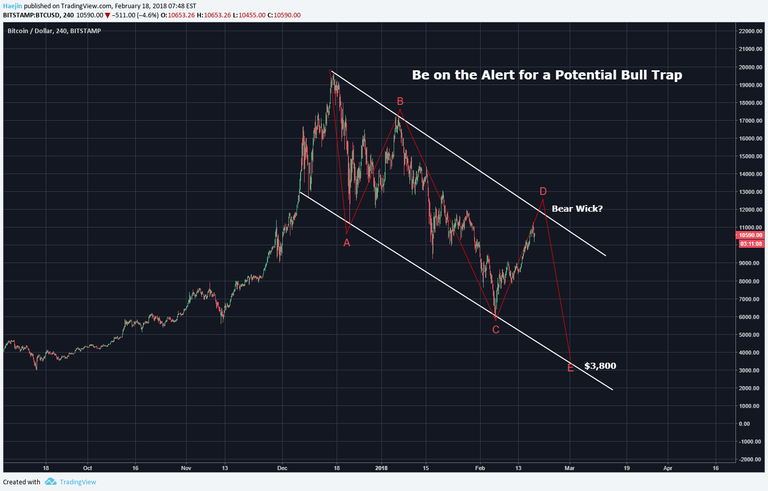
Here is a chart of a longer degree of trend view. Once BTC reaches the top blue line to around $12,354; that becomes a critical junction.
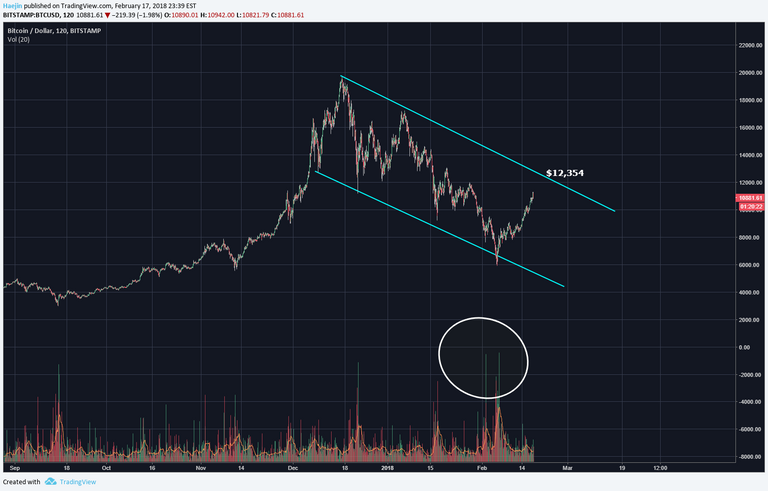
What happens at that critical junction will determine whether this whole rise was a bounce or not. More to come in later posts as to what to lookout for at this juncture.
Overall, we need to have into close awareness the potential for a bull trap scenario. IF we see indications of this; farming for cash could be desirable! I still remain bullish and believe the bottom is likely in; but NOT fully until we breach this top blue line decisively.
Legal Disclaimer: I am not a financial advisor nor is any content in this article presented as financial advice. The information provided in this blog post and any other posts that I make and any accompanying material is for informational purposes only. It shoud not be considered financial or investment advice of any kind. One should consult with a financial or investment professional to determine what may be best for your individual needs. Plain English: This is only my opinion, make of it what you wish. What does this mean? It means it's not advice nor recommendation to either buy or sell anything! It's only meant for use as informative or entertainment purposes.
Please consider reviewing these Tutorials on:
Elliott Wave Counting Tutorial #1
Elliott Wave Counting Tutorial #2
Elliott Wave Counting Tutorial #3
Laddering and Buy/Sell Setups.
Laddering Example with EOS
Tutorial on the use of Fibonacci & Elliott Waves
@haejin's Trading Nuggets
Essay: Is Technical Analysis a Quantum Event?
Follow me on Twitter for Real Time Alerts!!
Follow me on StockTwits for UpDates!!
--
--


I believe @haejin is correct about his long term view of bitcoin dropping to around $4k
The graph above shows a major crash back in 2014 around the same months as now and it is very similar to the crash we are having now
(My wave counting might be off but same destination either way)
Here is current crash with what is expected to happen similar to the crash in 2014. History tends to repeat itself.
The difference seems to be this crash is happening a lot faster than the one in 2014 but that makes sense consider bitcoin is a lot more popular now than it was then.
Meaning this correction shouldn’t last as long. And then after this final lower low, we should see higher highs of $20k+ in the months to come.
We will just have to wait and see what happens, be prepared for anything.
Thank you Haejin, I learned everything about EW from your tutorials and they are priceless, and your daily updates calm my storm when things start acting up.
It's great to see the comparison, thank you.
As much as we would all love 4K BTC, I do see some fundamental differences between the two senerios. Mainly with volume confirmation and the inverted H&S pattern that was absent in 2014.
Thanks for your update, @Haejin!
Bitcoin Breakout IMMINENT! Where will it go?! https://steemit.com/bitcoin/@investingtips/imminent-long-term-break-out-up-or-down-for-bitcoin-this-is-a-pivotal-moment
As long as the DUA continues to remain so uncharacteristically low as it is today I would not expect to see real recovery until that metric begins to creep up again. I wrote about this a couple of days ago and it is still down. Hopefully, many are reading till the last line to note that the bull trap scenario continues to be in play. It is possible that the bottom was already in but the price continues to be quite heavy today compared to its established value trend of 9 years. I believe there are some deep fundamentals that characterize this, which is captured in sentiments, and then gets expressed in the charts.
Valid point...great article...
Hahaha! Good one!
well memed
Thanks :)
sense of humor is medicine
Some potential movements to form the right shoulder
This fits well into my forecast with a wedge forming a shoulder. Be interesting to see if it is as large as yours. I'm thinking smaller and more downward. Thank you Haejin for community and awareness.
LTC is also forming quite a long pennant, I've been mapping this Inverse H&S for about two weeks, this was my initial count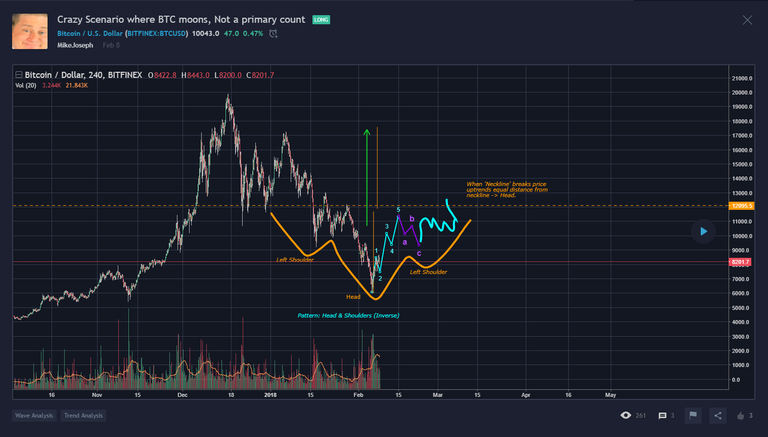
LTC chart is messy looking in comparison but the volume confirmation is amazing.
Hi, @haejin - if btc drops to 3800, what then?! Maybe it will keep going to zero?! (I f*cking hope not!!)
Dude if it goes to $3800 then it’s off to $20k+ guaranteed. I’m actually hoping it drops to $3800 to buy more. There’s too many whales looking to make a lot of money from bitcoin for them to just let it drop to nothing.
There is absolutely massive money coming in during 2018. The institutional money, pensions, family offices, etc. If 3800 happen's, perhaps the big boys cause it so they can get their money fully invested.
I hope so!
just like the 'yearly' dip occurs when wall Streets hits bonusses, strange coincidence :)
Strange it is:)
That would be nice!
That is no possible !
Maybe, if we lose internet.
I'm still very wary of the fact that most of the btc is owned by so few people, if they decide to cash out, it's over.
Check up my article on a possible realignment that might be beginning to shape up. There is a good chance that we might be beginning to see blockchain growth where bitcoins is not as much its driver as it used to be. Either that or the upcoming Lightning network will return things to how they used to be and usher in even more explosive growth by solving the scalability problem to an extent. But something may have to give because on the fundamentals it doesn't look like bitcoins has currently fully recovered.
I'm guessing you own zero BTC, so yes your BTC will be zero.
I'm just saying that because if I thought for a second BTC was going to zero I certainly wouldn't invest in it. Blessings
Also you mention how wave 5 could breach the upper channel boundary briefly, but given that primary wave 1 could retrace 50%, what would be indicative of a scenario of probable lower low vs. a normal primary wave 2 correction? Would the volume profile be different?@haejiin, Have you notice how the sub-micro (in your chart not the one bellow) wave (1) and wave (3) have the exact same length. It is common in an ABC correction for wave A and C to be equal but in an impulse Wave 3 cannot be the smallest... which is why I have labelled this as an ABC yesterday. Is this another scenario to be aware of? Or do you have arguments to take it off the table?
Thanks a million for all your posts and teachings.
Wish you the best!
hi thanks again !
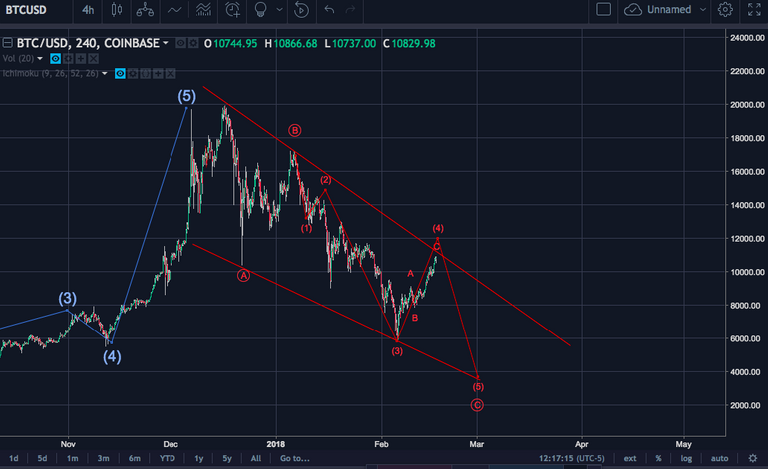
i choose to believe the 5 larger downward waves are alreay in :
its made using standard toilEtt waves
we need volume to move it to 12k
Bull Traps are Cryptos M.O.
Upvoted.
Thanks.
hi @Haejin, you didn't put the abc correction after the end of wave 5, which means when it touches $12,354 it will have to do ABC correction before attempting it again. This is so that everybody remembers we have up to 50% retrace ahead in either case. But as as always, great analysis and thank you!
Thank you for your analysis, Upvoted (y)
Alt coins are starting to look like a nice set up to start impulsing; XVG is starting wave 3 I believe.
I'm confident that if it breaks through 12.5k the bulls will be in full force. Roll on March, I have a feeling it's going to be a good one.
Haejin,
Hello and good afternoon from Sevilla, Spain.
Ive been watching you for awhile now, but just realized you ALSO have steemit.
Will be following you and upvoting all you do for this community.
BLESS
Domenico
FIngers crossed for the decisive break upwards.
I'looking at the euro chart and there it is flirting with the top line for a couple of hours already.
interesting
Just wanted to show what it looks like on Bitfinex.
의견 감사합니다. 3천달라가 되면 장이 어떻게 움직일 지 궁금하네요.
@haejin, how do you define a "decisive breach"?
perhaps a larger one than just a shortlived wick ?
thanks for sharing!
Thank you; your update was very helpful!! :)
In previous years, on start of every year bitcoin had a crash. you may view history of BTC Price to verify.
Your alternate pathway helped me not to rush during the huge breakout upward. You're really helpful Haejin Lee <3
we need volume to move it to 12k
Good post!
Can you do a TA for IOST on binance.
It seems to be following the vision of EOS and BTS@haejin
Anybody see these numbers on graphs?!? This is a joke...
The potential to drop to 3800?
You’re a joke
Very impressive. So many other analysts were saying 9k would be the top for this month. So far Haejin have been right. Great work and thanks.
Sir , you taught me everything, will never forget you , thankyou and health of the world for you and your family .💐💐💎
Your writing is really a beautiful and clean mind telling you, your mind is like a great mountain and sea as a liberal.
Man's love for the people you spell cost whether you may be long live.
DEAR FRIEND THAK SO MUCH
항상 많은 도움이 됩니다.
Thank you always.
So far, you've been amazingly precise! Thanks again :)
Here is what is happening then: We will meet at the Moon! :)
This man is going to the Moon! You can go too

Read how you can help send him there here
https://steemit.com/cryptocurrency/@talesfrmthecrypt/president-trump-to-take-crypto-to-the-moon-space-trump-coin-ico
Good work and thanks for yiurwonderful updates have a nice day @haejin
Hope there is not any more any big disaster.In any market this is quite acceptable. Thanks for your post.@uovoted and resteemed
Thank you!
Waw amazing
Thank You !
What is happening with the RISE coin ?