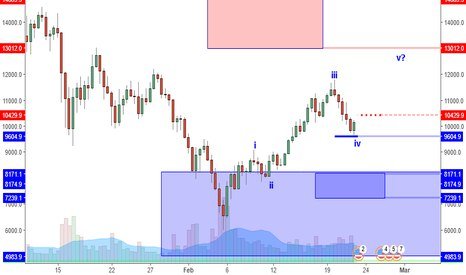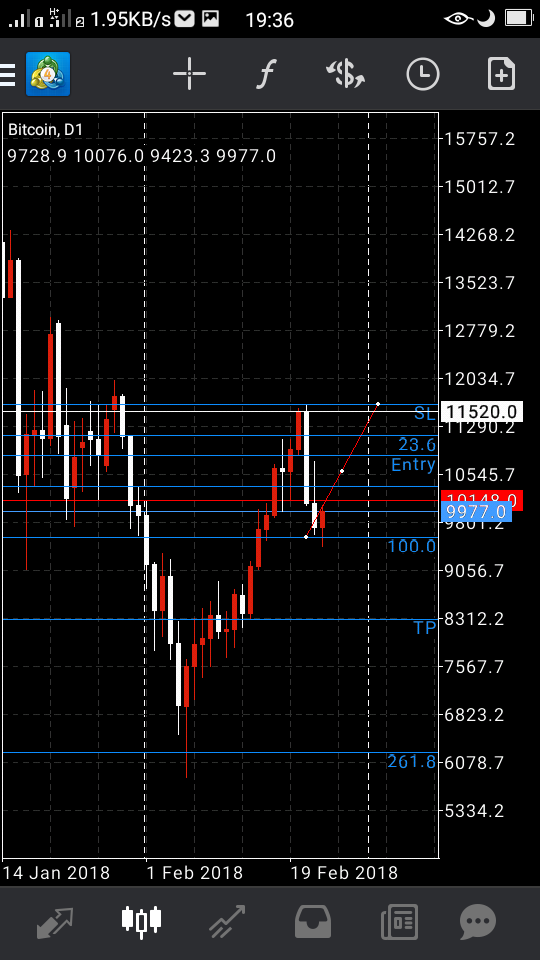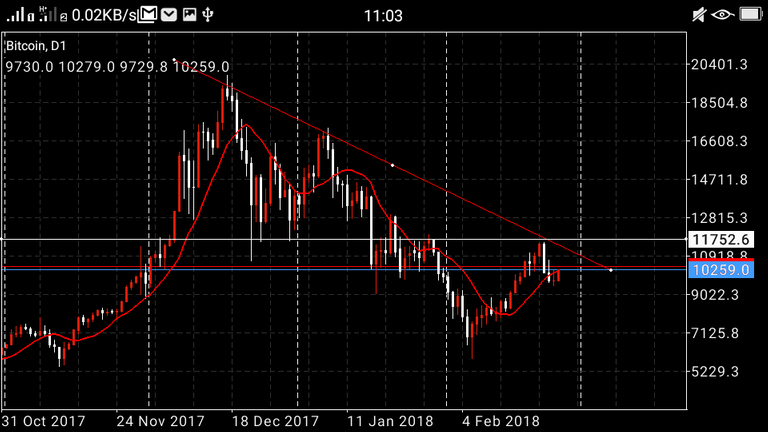
Bitcoin's (BTC) overnight price action has completed and confirmed the symmetrical wedge fractal as shown in beow chart.

Using the first fractal's subsequent price action, the below pathway could be approximated for the second fractal:

The fractals can also be presented as bull flag pairs. While exact patterning might be different, the destination is often shared.

The larger pattern still remains the Inverted Head & Shoulders pattern. The Neck Line remains at $12,000 and this is the zone that price needs to breach to complete & confirm the bullish pattern.

Legal Disclaimer: I am not a financial advisor nor is any content in this article presented as financial advice. The information provided in this blog post and any other posts that I make and any accompanying material is for informational purposes only. It should not be considered financial or investment advice of any kind. One should consult with a financial or investment professional to determine what may be best for your individual needs. Plain English: This is only my opinion, make of it what you wish. What does this mean? It means it's not advice nor recommendation to either buy or sell anything! It's only meant for use as informative or entertainment purposes.
Please consider reviewing these Tutorials on:
Elliott Wave Counting Tutorial #1
Elliott Wave Counting Tutorial #2
Elliott Wave Counting Tutorial #3
Laddering and Buy/Sell Setups.
Laddering Example with EOS
Tutorial on the use of Fibonacci & Elliott Waves
@haejin's Trading Nuggets
Essay: Is Technical Analysis a Quantum Event?
Follow me on Twitter for Real Time Alerts!!
Follow me on StockTwits for UpDates!!
--
--


i like Bitcoin (BTC) Morning . thanks for sharing post
Hello Haejin. New here so trying to understand. This downtrand from 11.8K is it an ABC which you think it has completed or ABC and now we are on B? the latter case is seeing here (copy the idea from

ew-and-patterns ) . thank you
This is my read too. It's a wave 2 that should retrace to about 50% or 61.8%
wave 4 of A can't more high than 1.
The last resistance point is now at the 10,000 level. Basically a magnet for price. Any stall in price may see it fall to this level, before being bought up heavily. This would be the ideal situation for an upmove...a failure to move below the 10,000 level is very significant.
I guess the $10k is widely seen as an important psychological level. However, the recent dip below it could have provided the low point for the Right Shoulder pattern.
up vote and resteem..
Hi @haejin! I've made a comparison of bitcoin performance between 2014./2015. and 2018. Can you please, as a pro TA, give me your opinion about this scenario? I see that BTC is potentially forming a reverse H&S pattern, but could it be a bull trap? Thanks!
The time frame is not the same, but market is moving much faster now..
I recall the 15 month bear market quite well. Back the, Bitcoin’s liquidity maturity was much less than current. I believe this feature is a strong determinant to how long the Hurry Up & Wait effect of impulse to correction cycle takes. Given that BTC is far more mature today than 2014; I believe the correction won’t be extended to 15 months.
Thanks!
spam and not cool.
I think the bitcoin will be $ 14,000 again
i hope bitcoin back again thanks for this update @heajin sir
Information is power.
Heajin
I have a question.
I think the accuracy since January is about 5 %.
Why did this happen?
Show me your ability!
his trades haven't even played out, don't read the timelines they are not meant to be accurate but look at over all trend. BTW these patterns can change on a dime you need to do your own research and understand why something moved one way as opposed to another. Stop asking people for predictions and learn, go do his tutorial.
I follow the analysis above. It makes sense. But aren't we in a downward ABC correction? Don't we still need the downward C wave to play out? Thank you!
I think it's actually an ABCDE correction
Haejin + CryptosRocket = WIN!! >> http://cryptosrocket.com/btc/2018/02/23/target-13000
Haejin, why no more youtube posts???
Hello Haejin, nice post. What do you think about this analysis?: https://steemit.com/bitcoin/@ilcapo1/cryptocurrency-market-analysis-in-depth
I think we have to be prepare for it
Lets hope we will ride the green wave again :)
Meanwhile if anyone likes free coins via fast airdrops check my blog there are several still active.
thank you so much for every morning update^^
Hasn't Bitcoin been going up on the weekends...?
i can't divide wave 1 into 5 waves.
if it is like this picture, wave 3 of 5 does not obey elliott's rule.
how do i divide wave 1 into 5 waves?
wow....what a nice post. i like your Bitcoin (BTC) Morning Update: This Wedge Has Breached post. thanks for sharing post
BTCUSD 3.59% update: Since the bearish pin bar off of the 11700 area price, has been retracing and has tested the 9600 level to produce a spinning top formation.
This can be the beginning of the next bullish leg which can test the 11700 peak or higher. In order to justify a long position, I would wait for particular conditions to unfold first.
Which particular conditions would those be?
@cannonball6 A more conservative plan is to wait for a higher low formation, and/or close above the 10429 level (.382 of current bearish swing). By waiting, you get less attractive prices, but you are entering with momentum clearly in your favor. This is more appropriate for my position trade since I plan to add about 30% more. The target for this trade is the mid 13Ks to 14K 0.95% area since it is looking to capitalize on the broader move. One advantage to having the position trade is even if there is no clear entry, and I never add, I am still long and benefiting from any bullish momentum that materializes. I am also willing to take the risks associated with this type of position as well.
By the way, I get a lot of requests to include wave counts on my charts. I am always aware of relevant counts, but show them on my chart when they are clear and offer insight rather than confusion. This situation offers that type of clarity with the current low fitting into a minor Wave 4 bottom. Which means this count is now inline with the broader bullish premise behind this market. This type of impulse wave, especially when the market is in a Wave 4, is the simplest and most effective way to use Elliott Wave in my opinion. Since 3 waves must be in place and adhere to the impulse wave rules, Wave 4 becomes the easiest wave to anticipate.
Thanks I appreciate the response
On what timeframe do you see a spnning top formation at 9600?
A condition like breach of Neckline to Head & Shoukders pattern.
Semoga harga bitcoin cepat membaik.dan meroket sampai 300 juta
Kayaknya bakal terjun lagi itu BTC bang siap2 aja beli di harga murah..
Insyaallah jika ada modal mantap tu
benar bang.
So bad perform again. Good post thanks.
Thanks dear sharing the bitcoin condition .I alwys see your post and follow you
Great update, Thanks. Always upvote and resteem you're posts.
Thank you for the update as always. You mean the big third wave is just started, right?
Coins mentioned in post:
it looks like BTC will plunge again because it does not break the level 11520.0 and there also formed candlestick englefling the reversal marks will re-occur .. please see my previous post on my steem page .. thanks .. newbie analysis
An engulfing pattern has to be fully engulfed by prior candle and extend beyond the length of prior candle. I don’t see that in this chart.
thanks sir for his response. me as a newbie just trying to learn if it's wrong let's fix it .. but i want to say if Bitcoin is currently positioning down trend and will go down it's just my view
Englefling candle TF weekly
If this inverse H&S will be confirmed, BTC should top about 17500 (12000 + ab. 5500 head height). Do you agree ?
Yes. So, we are at a critical price juncture.
thank you for this post master :)
Coinbase and Bitfinex Upgrade to SegWit, An Upgrade That Could Fix Bitcoin’s Slowness Problem:
http://bit.ly/2CC2P1t
I hope so~ haha
So possible reversal around $8500...looks like?
dingdong!
Did you her the great news about our Lord, the upvote for upvote and follow for follow?
hi @haejin.. It took 16 days for right side of head to beginning of RS. so took 32-34 days to form head part. Usually price drops down really fast when HS forms. How about IHS?? Do u thınk price to go up ( approx +$6K) would be İn big candles?
The minimum target would be about $17k for IHS
Isn't the chance for an IHS to happen about 60%? That's what I've read somewhere based on some research.
Nobody sees this head and shoulders?
Yeah, I saw that. Haejin, care to comment? THANKS!!
Haejin you should not be so bullish on bitcoin because many people will lose money if they follow every word of you.
click here.Congratulations @haejin, this post is the sixth most rewarded post (based on pending payouts) in the last 12 hours written by a Superhero or Legend account holder (accounts hold greater than 100 Mega Vests). The total number of posts by Superhero and Legend account holders during this period was 50 and the total pending payments to posts in these categories was $4373.23. To see the full list of highest paid posts across all accounts categories,
If you do not wish to receive these messages in future, please reply stop to this comment.
Congratulations, your post received one of the top 10 most powerful upvotes in the last 12 hours. You received an upvote from @ranchorelaxo valued at 214.68 SBD, based on the pending payout at the time the data was extracted.
If you do not wish to receive these messages in future, reply with the word "stop".
That's a lot o' spam!
One more time Hey-Dginn: