If knowledge is power, today’s traders are stronger than they’ve ever been. The range and function of analytical tools is improving by the day, presenting investors with a smorgasbord of options. Sites such as Onchainfx are continually adding new features, empowering traders to make more informed decisions based on more data sets.
Today’s Investors Have an Enviable Suite of Analytic Tools
From technical analysis to fundamental analysis, the best traders leave no stone unturned in their quest to find hidden gems. Low market cap coins with a solid development team; tokenized projects with the potential to 10x; altcoins that have been unfairly pummeled and are due for a rebound. All this, and much more, can now be gleaned in little more than a few clicks. There’s no need to connect to APIs and painstakingly perfect spreadsheet formulas, for the best online toolkits do it all.

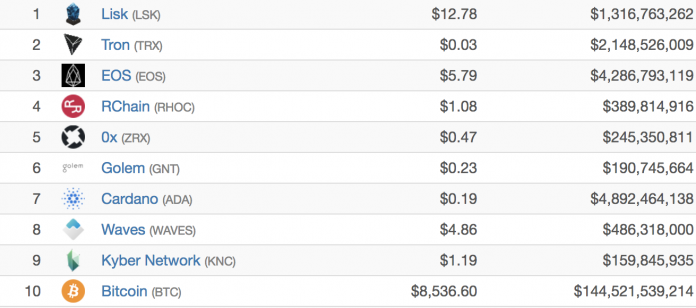
The cryptocurrency top 10 ranked by 90-day Github commits
Onchainfx is the jumping off point for many researchers. Altcoin information such as 24-hour transaction volume, number of transactions per day, NVT ratio, fees, and short-term ROI can all be viewed by enabling the appropriate checkbox in the right hand margin. You can then click on a column to filter results based on the metric you’d like to measure. This week, Onchainfx upped its analytics game by adding data for Github repos. It’s possible to filter coins based on the number of Github stars, watchers, commits, lines added, and lines removed. Now lazy altcoin devs have nowhere to hide.
Previously, the only place where this information could easily be compared was on Cryptomiso. According to Onchainfx, the busiest crypto project over the last 90 days has been Lisk (1,620 commits), followed by Tron (1,240) and EOS (1,032). The less said about Dogecoin’s Github activity the better. For anyone who places a lot of weight on Github ratings, Darpal Ratings delves into these in much greater detail.

Live Coin Watch
Live Coin Watch Demystifies the Data
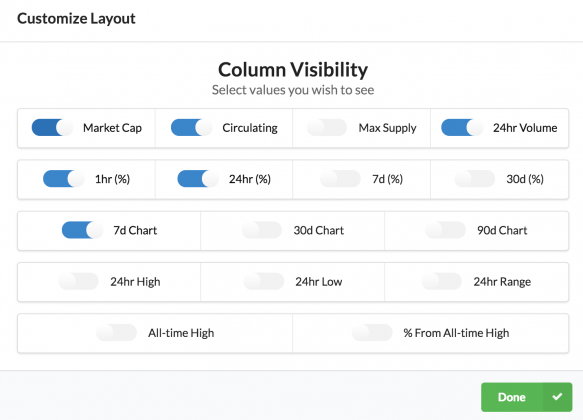
Live Coin Watch is another up and coming site making data sexy. The best thing about the cryptocurrency tracker is its customizable layouts. At the toggle of a button, you can view which coins are down the most percent from their ATH. Combine that with data on a coin’s Github activity, or price based on BTC normalized supply, say, and you’ve got a ready reckoner for which alts are unfairly cheap.
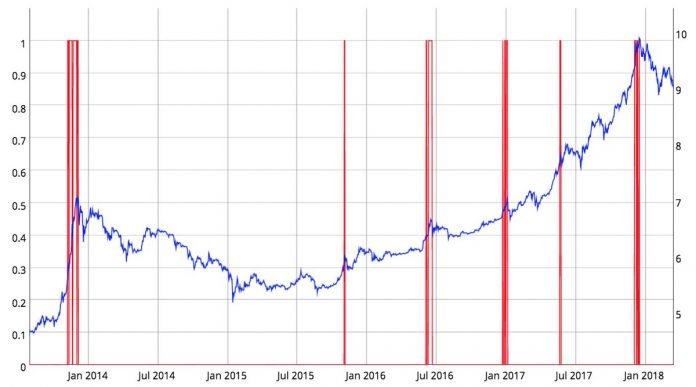
For more serious traders, who thrive on log charts and rolling correlations of daily returns, Coinmetrics.io is the only tool that counts. It’s not the easiest platform to master, but the knowledge it bestows upon those diligent enough to put in the time can make the toil worthwhile. Even the simpler charts Coinmetrics cooks up, such as a retrospective of the times bitcoin’s RSI exceeded 75, are fascinating.

Areas in red show when bitcoin’s RSI surpassed 75.
After the fact, all sorts of patterns become clear showing when markets were blatantly overbought or oversold. Discerning that at the time though, and using it to guide future trading decisions, is harder than it sounds. In the current market conditions, altcoin trading is a hazardous pastime. But as news.Bitcoin.com noted in last week’s podcast and Sunday round-up, it’s a great time for building and learning. The tools you add to your arsenal now will prove invaluable when the time comes to intrepidly venture into the altcoin markets once more.
Hi! I am a robot. I just upvoted you! I found similar content that readers might be interested in:
http://www.bitcoininsider.org/article/21112/new-tools-help-crypto-traders-make-smarter-decisions
I like this. Followed you
I Upvoted And Followed you. do The same for me and we could help each other Earn.
sTART WITH THE head on your SHOULDERS
I Upvoted And Followed you. do The same for me and we could help each other Earn.