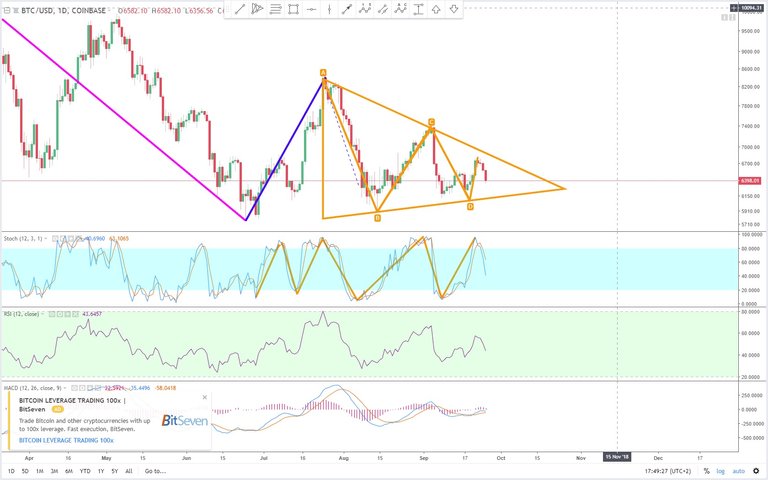
The stochastic 12,3,1 on the daily chart correlates well with orange trend sections.
The last 2 orange trend sections were drawn incorrect for the sake of showing the correlation.

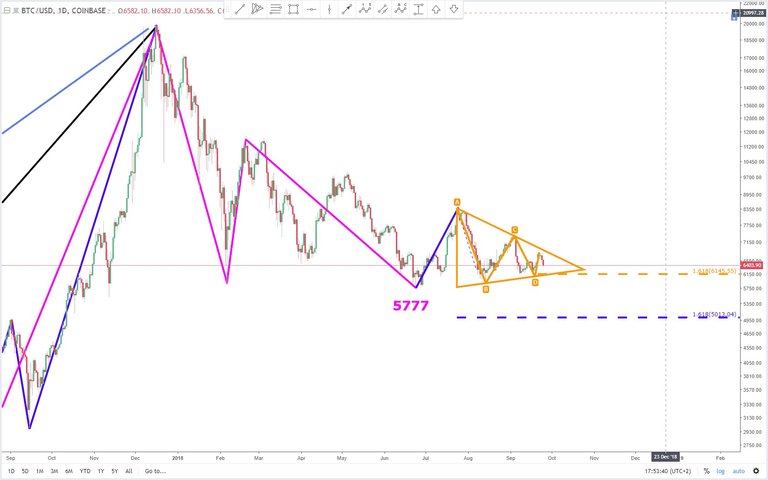
The next picture summarizes the orange trend sections into the triangle they have created.
The last 2 orange trend sections are drawn accurately now.

Overview price targets:
- green : not available
- orange : 6150
- blue : 5000
- pink : same as blue, not drawn
Interpretation:
The opposite to the interpretation of yesterday. The price will break out short from the triangle since price targets of big trend magnitudes wait below it.
