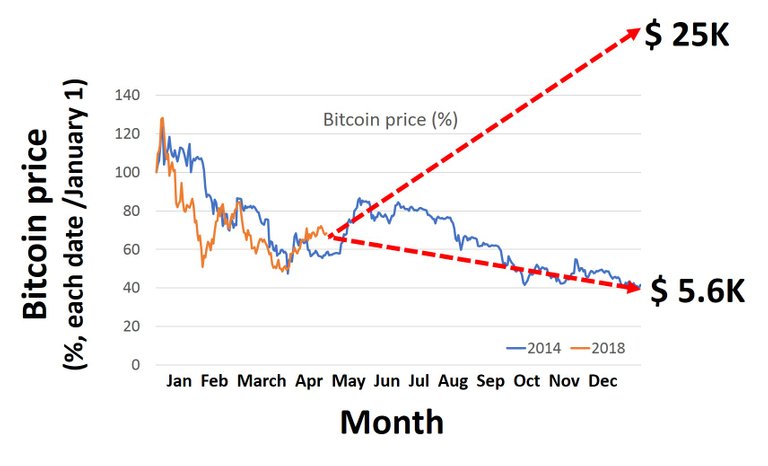
This below graph I mentioned previously several months ago. Incredibly, the current pattern is similar to 2014.
What is the next?

This below graph I mentioned previously several months ago. Incredibly, the current pattern is similar to 2014.
What is the next?
