sudden drop in prices of bitcoin shocked almost everyone, prices break the ground support of $6000 and created new lows almost $4200 of 2018. now obviously this is not something which is unexpected and also not happening first time. bitcoin is facing this situation for the third time.
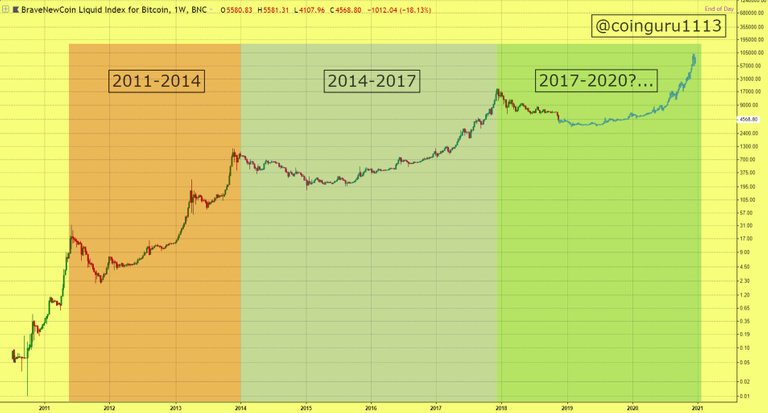
now i won't stretch this so long coz one image is better than thousands of words, and history have patterns which repeats again and again. so let's begin...
everytime when i see this chart i wonder how amazingly accurate predictions it has, hats off to that chartist...
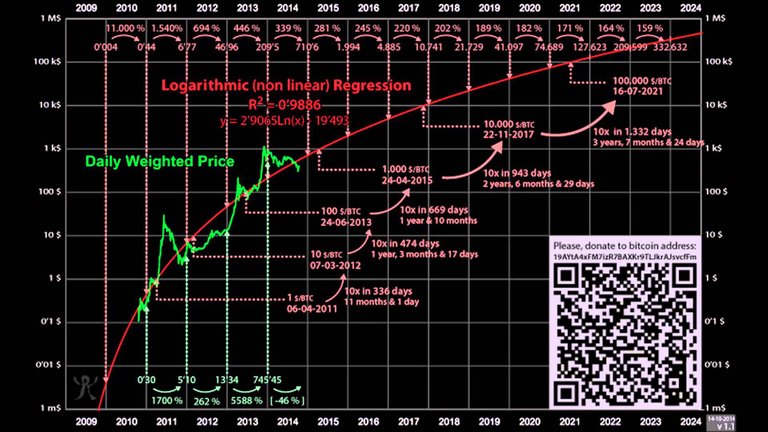
a broad view of 2013-15 bitcoin price movements
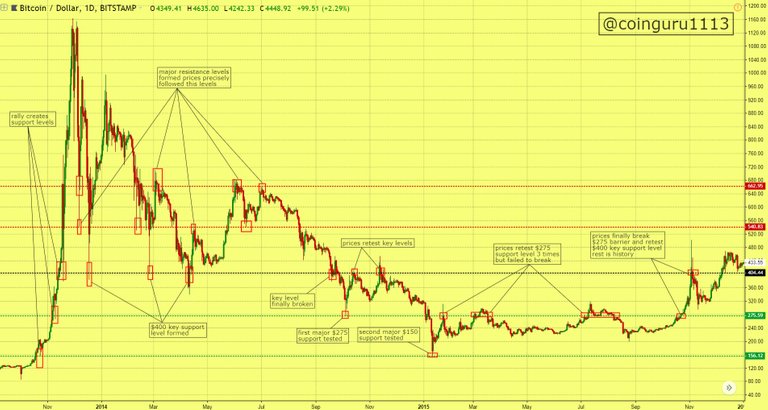
zooming in.
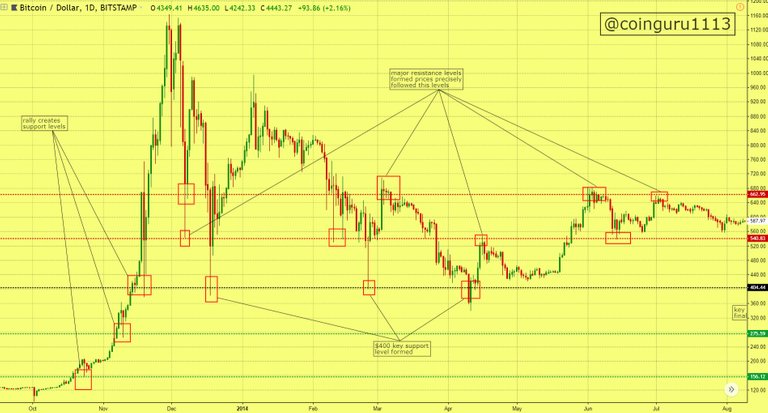
prices begin to climb after reestablishing $100 milestone and pullbacks creates support levels on $150, $275 and $400. after establishing new all time high of $1160 major resistance levels formed to halt rallies and $400 act as a key support level.
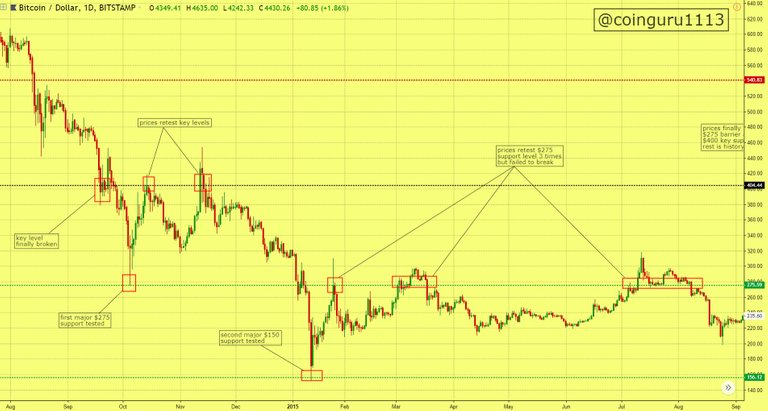
prices finally breaks key level and hits first support of $275. again prices recovers and tests key level twice and forms a double top formation. finally breaks the $275 support and hits $150 level, forms a rock solid bottom and retest the $275 support three times but failed to break it.
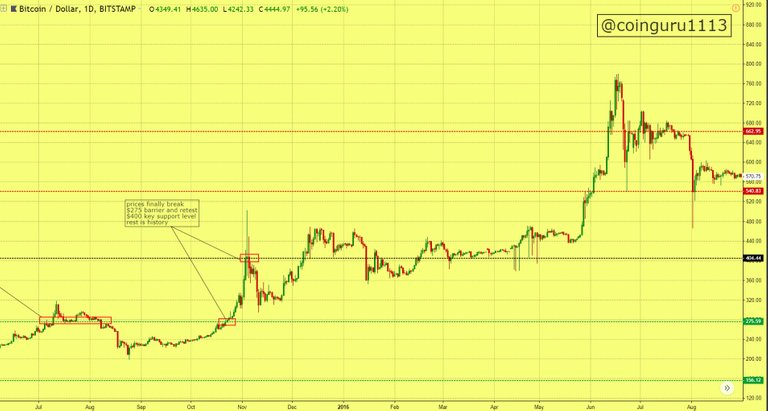
in a forth attempt prices finally breaks $275 barrier and even breaks the $400 key support level, indication for the next rally after a major pullback most likely to be a bear trap, rest is history...
applying this pattern on current situation of bitcoin
zooming in...
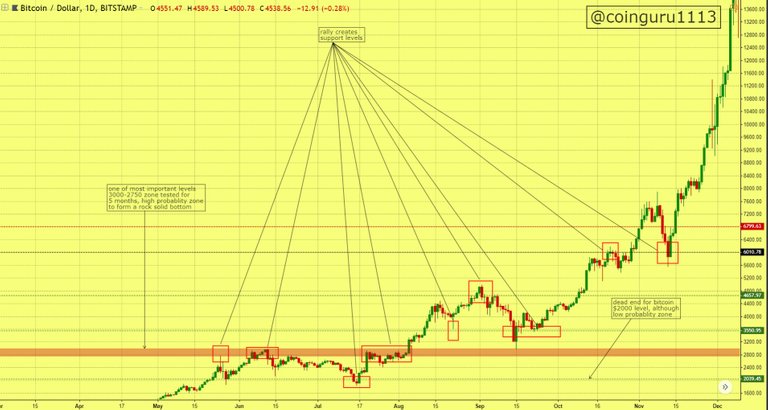
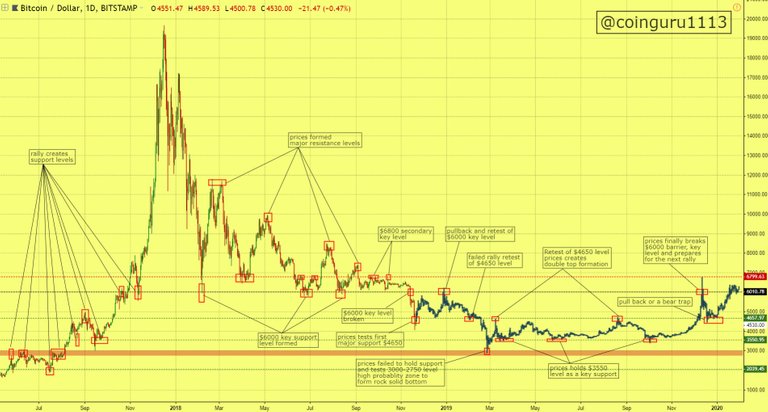
prices begin to climb after reestablishing $1000 milestone in 2017, pullbacks creates major support levels of $2000, $2750-3000, $4650 and $6000.
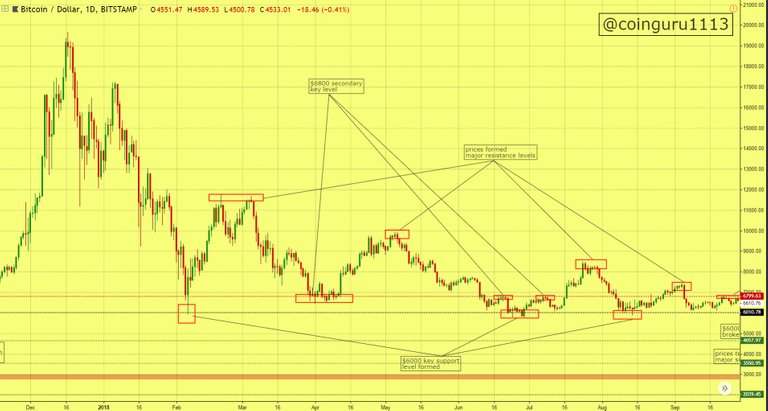
after establishing new all time high of $20000 major resistance levels formed to halt rallies and $6000 act as a key support level.
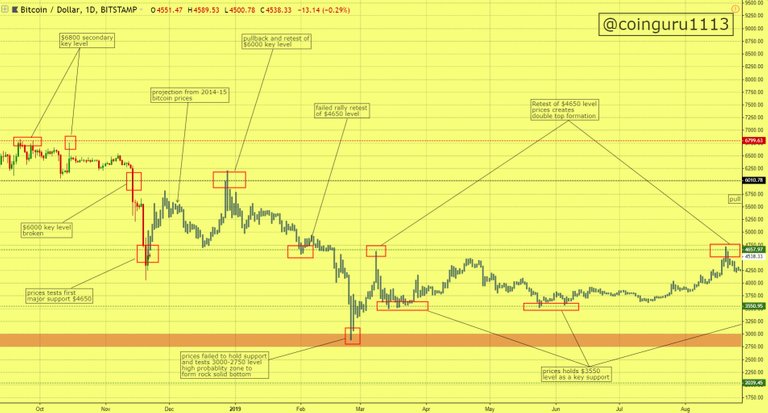
prices finally breaks the key support level of $6000 and tests first support of $4650. now from here applying 2014-15 price pattern.
a major pullback could occur to retest the key support level $6000 and probably we could see a double top formation before the next crash.
prices will fall again to support level of $4650, shows little bounce and then finally breaks it to hit 3000-2750 zone to form a rock solid bottom.
prices will regain the strength and quickly jumps to retest the $4650 level but failed to break it and hits $3550 support level.
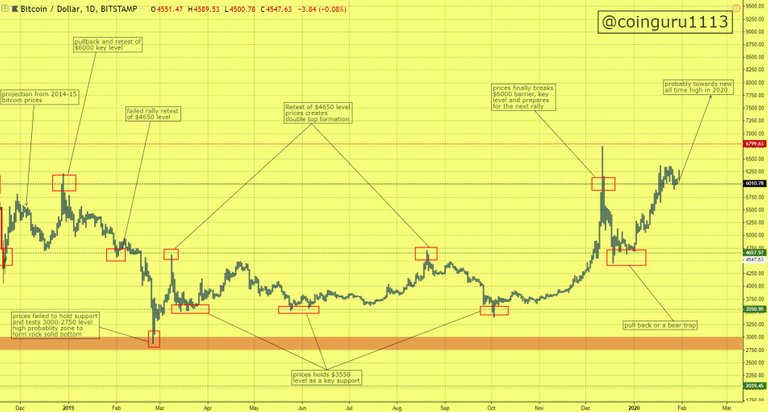
prices hold $3550 support as a key level for next few months and retest $4650 level to form a double top formation.
in third attempt bitcoin finally breaks $4650 barrier and also breaks $6000 key level, an strong indication for the next rally.
a pullback occurs to retest $4650 level which will be more likely as a bear trap and then bitcoin will finally get prepared to break the records and for a new all time high, most probably in mid 2021.
in the end all this predictions are just mirror image of 2014-15 price actions, no one knows the future, but above predictions looks more likely and realistic from what we've learned from history.#analysis
disclaimer : none of the above predictions can be taken as a financial advice, make decisions from your own resposibilty.
follow us on
telegram : https://t.me/coinguru1113
twitter : https://twitter.com/CoinGuru1113
thanks for reading this team CoinGuru signing out
Congratulations @husainabdul72! You received a personal award!
You can view your badges on your Steem Board and compare to others on the Steem Ranking
Do not miss the last post from @steemitboard:
Vote for @Steemitboard as a witness to get one more award and increased upvotes!