
We've all had a bad day. Many people was freak out due to big correction in crypto market but is important to know that the phenomenon has occurred many times in the past. So right now lets analyze that with some technical analysis
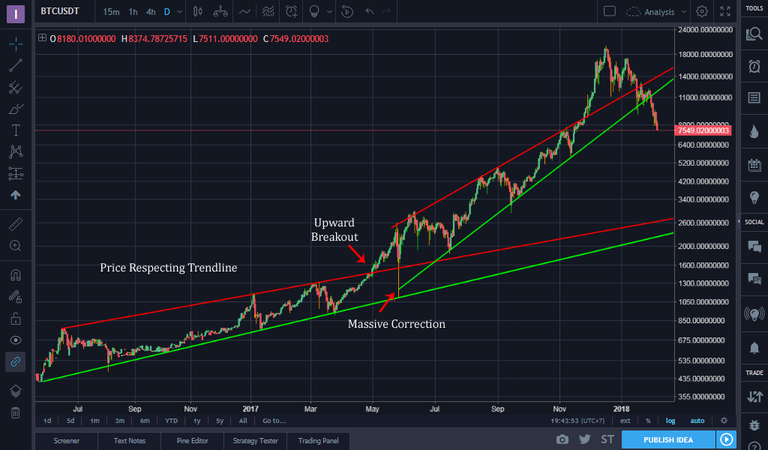
The price is following trendline started from July 2016 until April 2017 green line became support and red line became resistance. Finally breakout happened in early May 2017 the price crazily went up but suddenly big correction came in June 2017 forced price down but afterward bitcoin started new uptrend movement.
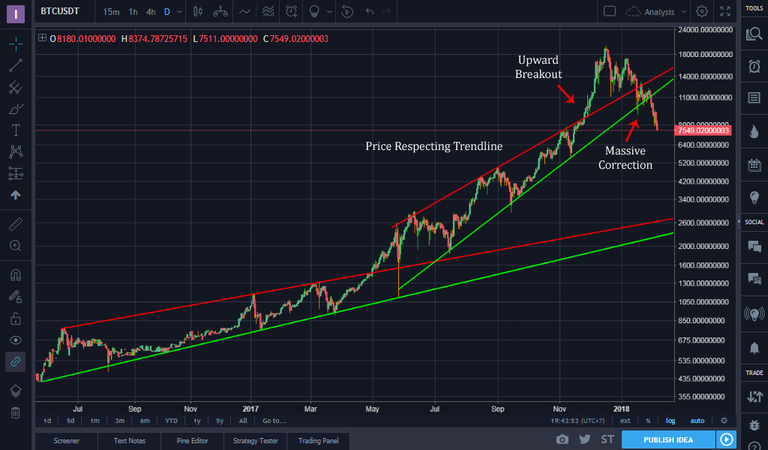
Now same thing happened again, started from July 2017 bitcoin continued to uptrend. The price is moved between trendline. On early December 2017 the price up move up quickly breakout the trendline and making new ATH and then followed by big correction until now
The conclusion is when upward breakout happen it will followed by correction then finally starting new trend move again. Right now Bitcoin is far from ATH but as far as I’m concerned Bitcoin is still good for long term.
What do you think of that? Let us know :D
Nice analysis. The daily chart has BTC running into the trend-line. Hopefully it is a slight pullback followed by some consolidation, then we are off to the races!
I hope so, still waiting for new trend direction.
Congratulations @indoanonym! You have completed some achievement on Steemit and have been rewarded with new badge(s) :
Click on any badge to view your own Board of Honor on SteemitBoard.
For more information about SteemitBoard, click here
If you no longer want to receive notifications, reply to this comment with the word
STOP