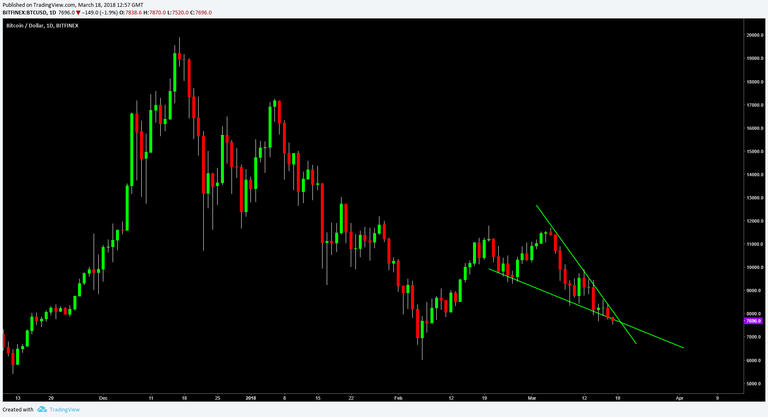
If we daily close strongly below the falling support line of the Falling Wedge (meant to always be a Bullish Pattern, but with Bitcoin who the f knows lol) in 11 hours time, I believe the up-trend everyone thought Bitcoin had started was just another bull trap. Obviously if it breaks the falling resistance line strongly upwards instead, then we could see at least another decent bull-run.

I do believe overall these crypto prices are unsustainable long-term and I have talked about this in my latest post if anyone wants to read more about my thoughts on this.
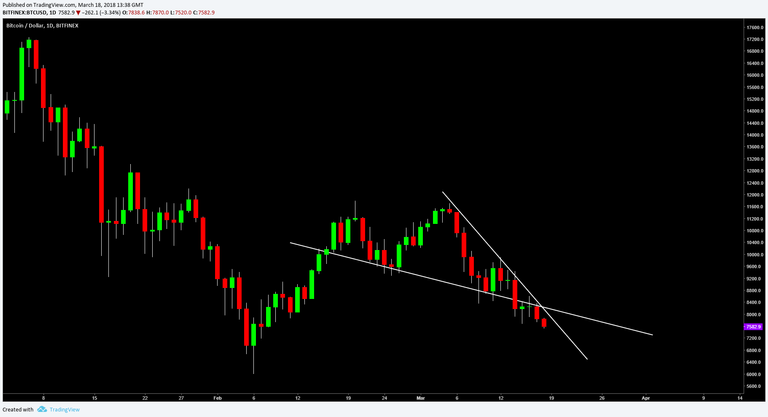
Edit: Doesn't look like we are still in the falling wedge to me anymore, because if you draw the line based on the first two significant lows within the so-called Falling Wedge, then this line tells us that we already broke out downwards:

I do see many people however still drawing it how I drew in the first image of this post which I am really starting to believe is the wrong way to draw it simply because if you were drawing that trendline live as the pattern was created, the line in my second chart would certainly have been drawn first. Price clearly closed below and then re-tested that line.
This is a lesson to be learned for me and anyone else who is prone to this mistake. If you are just drawing the trendline for the first time on a chart for a pattern which has been going for some time, think about how you would have drawn your trendlines if you had been watching it unfold live from the moment the chart pattern started.
Not looking good either way for Bitcoin.