Bitcoin is currently trading, as of the time of this writing, at $9,048, with a daily high of $9,225 and a low of $9,028. Yesterday we talked about the wicking down to test the 200 Day Simple Moving Average on the Daily Chart, a level that Bitcoin has closed below only once in recent history. A movement below this line would have signaled, for me, the true beginnings of a bear market, and my exit position to buy back in at a lower price. However, the course of price action today has been that of a nice bounce back.
After touching that dread SMA 200 Line with a long wick, price has rebounded and managed to stay well above that level. We see that price action is still maintained withing the falling wedge formation that I have been consistently charting, and a breakout of this formation will be required to signal a return to a strong bullish impulse. However the signs that the bottom is in are possible, although conflicting. Let us look at the charts.
The first chart shows the daily chart for Bitcoin. As we can see, yesterday's candle closed nearly double the trading range of the previous day's candle, a nice bullish sign. The Stoch RSI is also curling upwards, and in the oversold region, also a nice confirmation. We also see a slight increase in positive volume growth. Although the current day's candle has retraced less than half of the previous day's trading period, I would have preferred to see another green candle. OBV volume indicator does not at this point show divergence, but shows volume following price.

The next chart is the 1hr. Here we can see a possible right angle triangle forming, and with overall volume decreasing this is a bullish indicator. We see a false breakout this evening, followed by the failure of the resistance to turn support, and now we will battle to break this crucial level of resistance at $9,100 before further movement upwards. We also see that the Stoch RSI is also overbought on the hourly, and that volume as displayed by the OBV metrics meets a resistance line also of it's current trend. We look for increased volume to break this resistance level shortly, followed by price action piercing the resistance level of $9,100. If this does not happen now, if the bottom is in it should occur shortly as the bands of the triangle tighten.

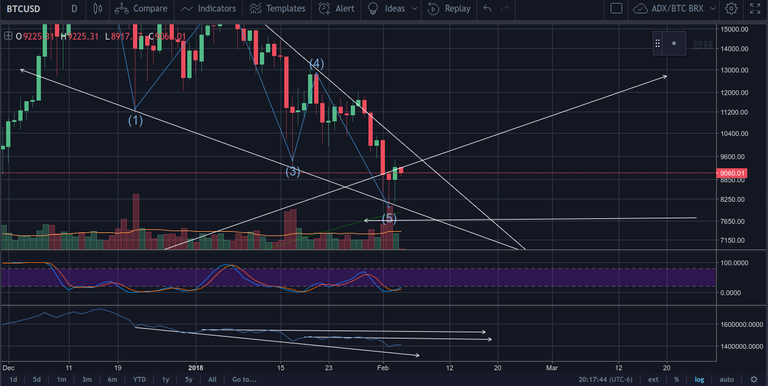
The last chart, as requested, is price projection. If the bottom is in, as displayed by the Elliott Wave corrective wave cycle, then the beginning of new set of impulse waves could be in. If we see this initial bounce and what could be the beginnings of a pullback as Wave 1 and the beginnings of Wave 2, then we plot, utilizing Fibonacci targets as the initial five waves, leaving us with a short-term target of $12,000. However, keep in mind this is the sub-wave formation of the larger Wave 1. If we see an extended fifth wave as is typical of Bitcoin, then utilizing a trend-based Fib Extension with a conservative 1.618 target of the 1 year growth of 2017, then we easily reach the 2018 target of $37,300. The waves may form differently, but the target is the same.
If you enjoy my content, please support me by upvoting my post, resteeming me, following me on Twitter (@JustinWiseFree), and leaving your thoughts and comments below. I'm always happy to answer questions and see what is on your mind.
Consider joining the Cracking Crypto Discord Channel, the trading group I provide content and signals for. We have a highly respected and experienced team of traders and investors, and an active community for crypto lovers and traders from all walks of life. https://discord.gg/Jj27gK2
This information is not financial advice. It's for informational and educational purposes only. Do your own research and due diligence before investing any money, and never invest or trade with money that you cannot afford to lose. Happy Trading!
thank for you information..
Your welcome!
Downtrend is slowly ending , in 2-3 months bitcoin going over 15.000 $$
Absolutely!
thanks for info but you misguessed the target of 2018 i think. It will be over that price in half of the year in my op. :)
Would love to see that!
@originalworks