Watching this historic rise of bitcoin has been exciting, but, like everyone else in the space, I can't stop thinking about when the next correction will be and how great it will be. When asking predictions from other members of the cryptocommunity, the two answers I hear the most are mid-December, and the first two weeks in January. For day trading, this correction could mean large profits, so I've decided to pull past charts to do a little analysis to see if history can point us in a more certain direction.
Here are charts incremented by a day, spanning from November 1st of each year and ending with February 1st of the following year.
November 1, 2013 - February 1, 2014
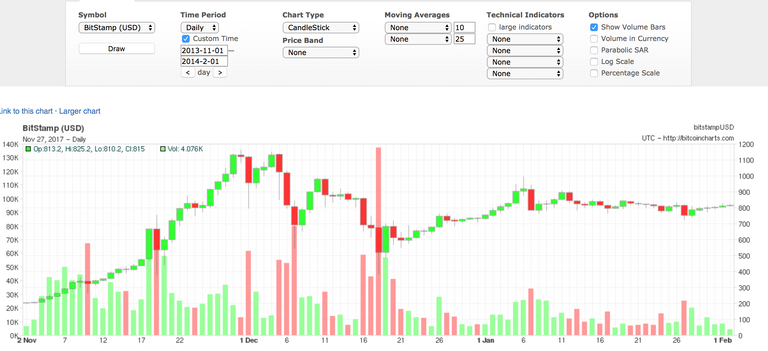
In this chart, we notice the peak price on December 1st, with the lowest point of the correction falling on December 18th. We can see the price steadily recovers afterwards without a severe fluctuation in momentum in either direction. In this time period, it took 18 days from peak price to reach the lowest point on the correction.
November 1, 2014 - February 1, 2015
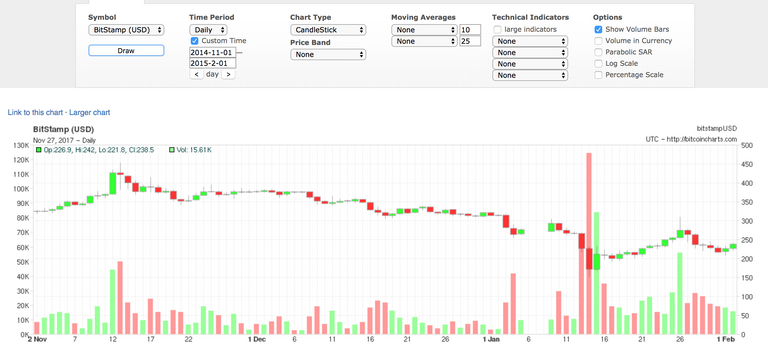
Here, the peak price arrives on November 13th, and the correction is slow and moderate until hitting its lowest on January 14th. This model has a notably less volatile price pattern than the previous year, and shows a slow correction that takes 62 days.
November 1, 2015 - February 1, 2016
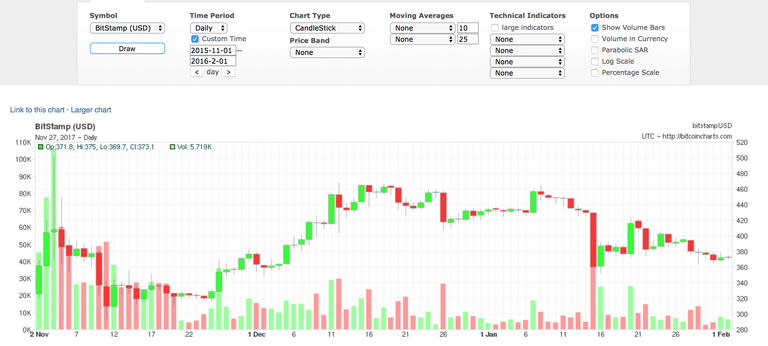
This chart is very interesting as it shows two corrections occurring in a 90 day time period. The highest peak occurs on November 4th, followed by a correction that bottoms out only 7 days later on the 11th, before returning to a high on December 12, with the corresponding low on January 16. In this chart we are shown a skyrocketting price early on that is quickly corrected, but rebuilds within the next month before correcting more gradually. For the sake of this analysis, we will count this as one correction to stay on theme with the other charts. In that case, the correction is more volatile and extends a longer duration due to the rampant fluctuations.
November 1, 2016 - February 1, 2017
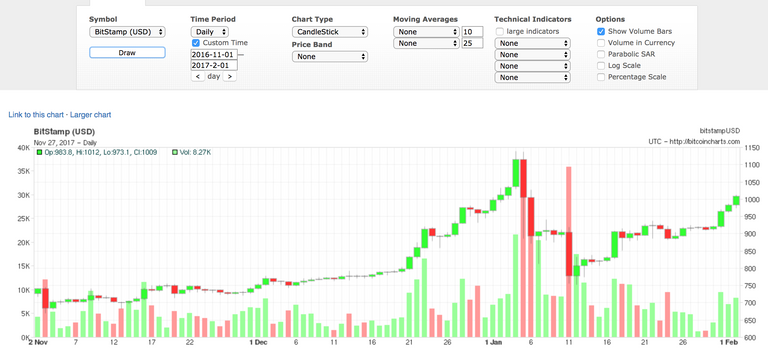
This year shows a more steady price throughout November and a steeper incline the last two weeks of December that leads to peak price on January 4th, with the lowest point on the correction occurring around 7 days later between the 11th and 12th.
September 1, 2017 - Present Day
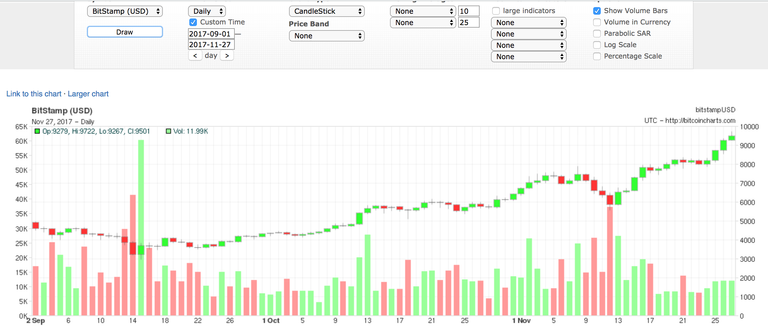
Because we can not see the future (hence this analysis) I chose to look from September 1, 2017 to November 27, 2017. This shows the first peak price happening on the 8th, with a rapid correction ensuing and bottoming on November 12th, the quickest correction in this entire collection. The bloodbath, however, is quickly eclipsed by the meteoric rise so far peaking today, November 27th.
Based on all these charts and the correspond information, I think that the current BTC market most closely resembles the 2013-2014 chart. I think the bullish candlesticks are most similar in pattern and grouping leading to the peak price on each chart. If we want to use this for reference in making our prediction, then we could estimate 18 days between peak price and lowest point in the correction: this would mark the lowest price on December 15.
According to these charts and the comparison and analysis, that would put the mid-December campers on track for having the more accurate prediction. However, as we all know, BTC is a crazy and difficult to predict market. What do you predict for the BTC correction? Sooner, later, or none at all and just a crazy ride to 10k by tomorrow? Let me know in the comments below!
I'll create a post with a few charts to predict price in the correction in a few days, but for now: Keep Calm and HODL on.
-Whitney @ JFTBC
****These charts are not investment advice, and should not be taken as such. This is merely speculation on observed patterns and is not a recommendation or endorsement on any trading decisions. ****
Donations Accepted and Appreciated!!:
BTC- 1CPHmQeGGb8BDecR6RWsfbFAA4
ETH- 0x27E7981E754e5C01704210a9067e56670Ae997C0
LTC- LYd3AdRASzhBQxJwvBMvQFhwqHsByP9TLn
Thanks for the post and learned many things about BTC.