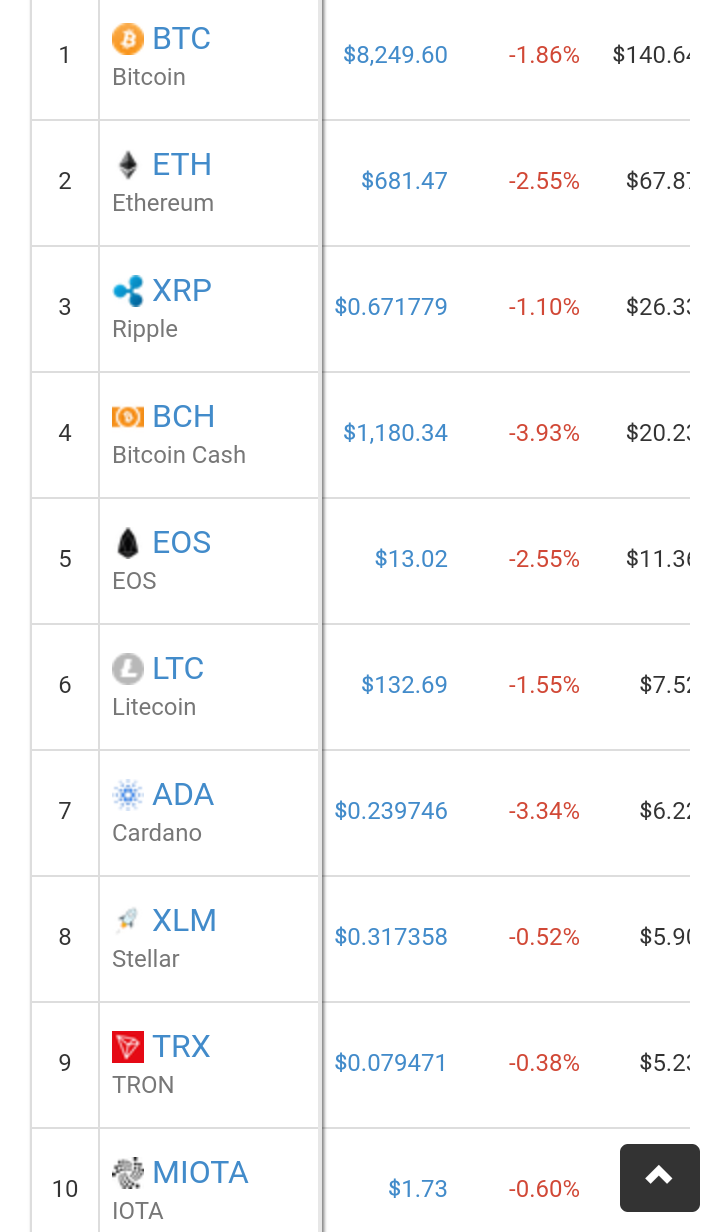
Market fervor appears to have been waning and all with crypto being in a down turn since December/January. Now, looking at the same ole memes and reading the same old rhetoric about "my coin is better than your coin" gets old.
It's times like these that you get bored and one has to find another angle to see this market from. That got me to thinking about coinmarketcap.com and its Top 10 according to market cap. How can you get a better perspective on this beside Price multiplied by Supply. What about how each crypto has performed daily (on average) since opening price at coinmarketcap? Yeah! That's a different approach. So here we go:
First, understand the process. This isn't trading advice. Just my perspective in order to get a fresh view.
A.
Current price/First opening price at CMC=Percent +/- ***
B.
Calculate number of days since First Opening Price
C.
#A ÷ #B = Average Daily Percentage up or down.
BCH. 304 0.70%
MIOTA. 344. 0.79%
LTC. 1851. 1.67%
BTC. 1851. 3.29%
EOS. 326. 3.86%
ADA. 234. 4.71%
XRP. 1753. 6.52%
XLM. 1387. 7.73%
TRX. 252. 15.38%
ETH. 1020. 23.72%Crypto. #Days @ CMC. Avg Daily % +/-
This is exactly what I said it was...an "average". Don't lose perspective.
Thought it was fun. Anyway, enjoy.
*** Don't forget to move the decimal over two places to the right for proper calculation.
Note: Coinmarketcap.com's first historical snapshot was April 28, 2013.
www.coingecko.com