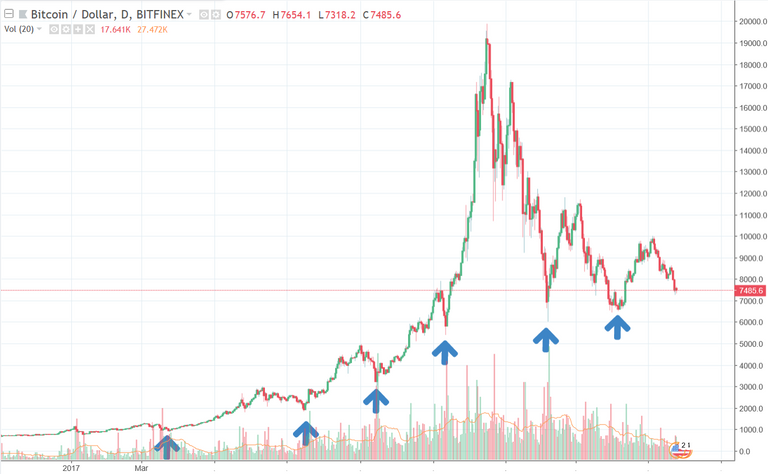
I am definitely not a trader and usually I barely look at the graphs. But these days, weeks and months feel like the extreme sentiments are getting bigger while they cancel out eachother.
On one side you have the weak hands and on the other side are the HODLERS.
The graph will definitely please this second camp.
The bullish trend
A quick look at the graph shows that bitcoin is still in its bullish trend and nothing has changed since the beginning of 2017 (and even earlier). The arrows on the graph point out the lows after each time that bitcoin set an ATH. It is clear that for a very long time we haven't got any lower lows, which means that the bullish trend is intact.
I never make predictions, but to me this sounds as a buy signal as we are close to the latest low!
