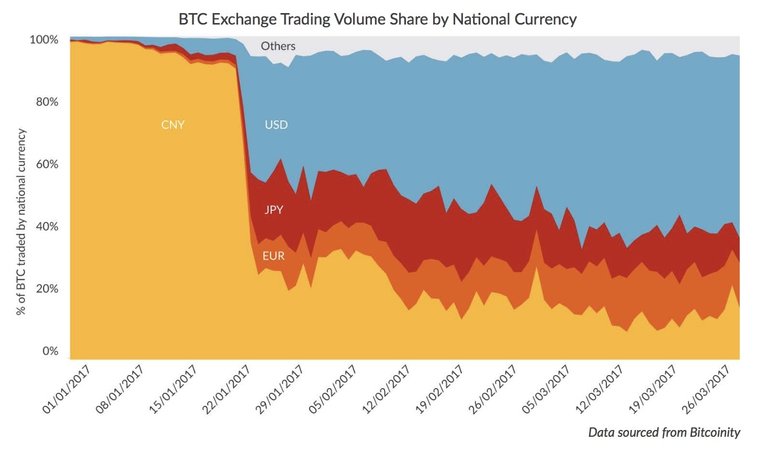
The chart sums up everything. This is the BTC exchange volume by national currency. As you can see things had changed since January 2017 when China tightened regulations. The CNY trading volumes have plummeted since den. The chart shows data until the end of March 2017, but I am pretty sure it looks similar today. The CNY has lost a big chunk of its share.

Data is collected from the top cryptocurrency exchanges.
Data sources:
Interesting chart, yet I am still pretty bearish on bitcoin for this year, read my latest article for more info
It was a crazy summer. Retracing could be healthy. I thing 2018 will be the greatest year in the history of BTC.
If anything, your chart proves that bitcoin is becoming more decentralized, and also with japan and russia entering the mining game, the future is bright :)
I agree
scary. But the future is bright.
Congratulations @kondor1030! You have completed some achievement on Steemit and have been rewarded with new badge(s) :
Click on any badge to view your own Board of Honor on SteemitBoard.
For more information about SteemitBoard, click here
If you no longer want to receive notifications, reply to this comment with the word
STOP