Bitcoin experienced a 20% down day this week after a bitmain blog post outlining a UASF/BIP148 contingency plan for a hard fork. The spot price has now recovered to previous levels, ending flat on the week.
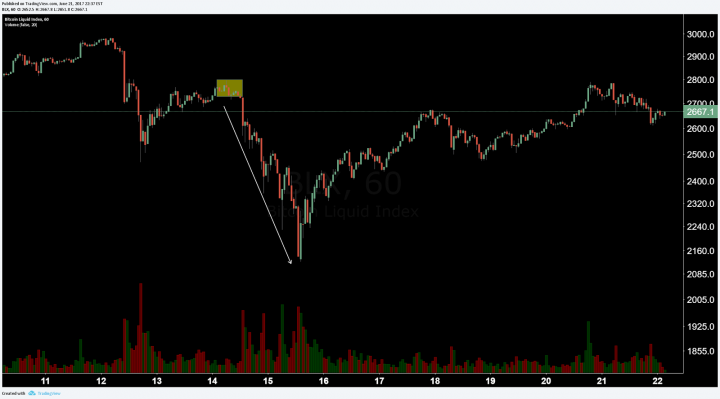
Currently, 85% of mining pools support “SegWit2x” which is taken from the New York Agreement, which states that SegWit will be adopted followed by a 2MB hard fork. This has largely been seen as a compromise between bitcoin core developers, nodes, Blockstream, miners, and others who wanted a hard fork block size increase. The implementation of SegWit is expected to be a large bullish event for price, as it will be seen as a piece of the solution towards network scalability. More on which developers and companies support which proposal can be found here.


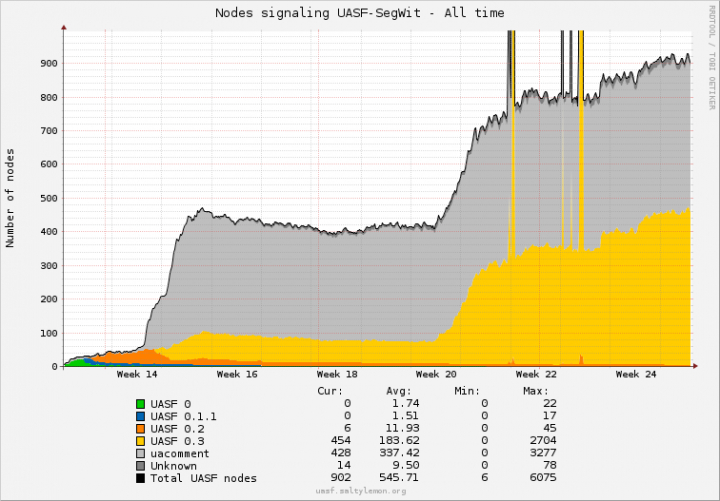
Despite the SegWit2x proposal, support for UASF/BIP148 continues to rise among nodes. This is in large part because the hard fork will not be coded by the core developers, is not complete at the present time, and has not been tested.
Network difficulty is now up 84.25% for the year. Difficulty increases as a function of hash rate, which also continues to break all time highs, and now sits at just over 5 trillion GH/s.
Technical Anaylsis
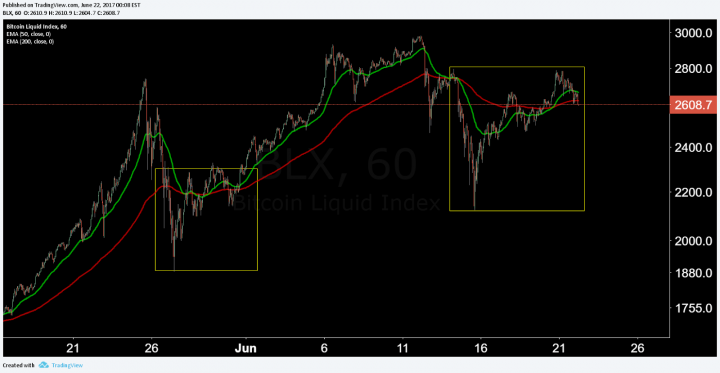
There is currently an inverted head and shoulders pattern on the 1h timeframe. The pattern has completed with matching descending volume profile. Fibonacci extensions and the measured move suggest a $3200 target upon completion. There are often throwbacks to the resistance turned support neckline (yellow diagonal), which is likely happening now. Should price break down further the pattern would be invalidated.
On the four hour timeframe, price has dipped below the cloud and reset. Price had a kumo breakout when breaking the inverted head and shoulders neckline, and will likely retest the Kijun and kumo support. These supports also match the neckline support test. Long trades will likely be entered at $2550 with stops around $2475, of the bottom of the right shoulder. A TK cross and recross above cloud would be another long entry signal.
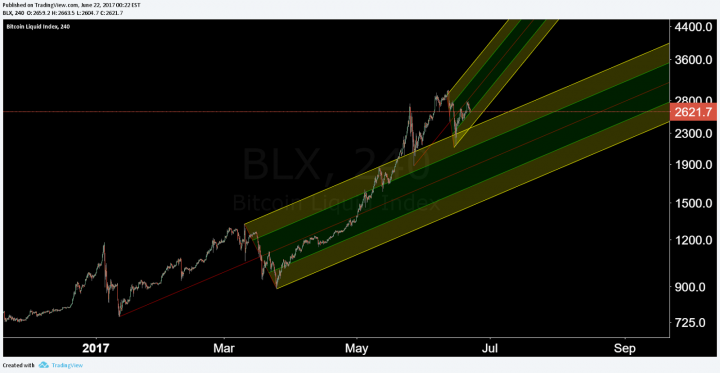
Lastly, a Pitchfork can be applied to the recent high and low. The median line (red) of the Pitchfork gives the expected mean of the trend. Price will continually attempt to return to this diagonal. Each diagonal of the Pitchfork can be thought of as a potential reversal zone or support/resistance line. The upper yellow diagonal zone being ‘most overbought,’ or the top bounds of the trend, and lower yellow diagonal zone being ‘most oversold,’ or the bottom bounds of the trend. The multiple price touches of the diagonals thus far suggests the Pitchfork has high validity, therefore, traders can project the trajectory of future price with a reasonable degree of certainty.
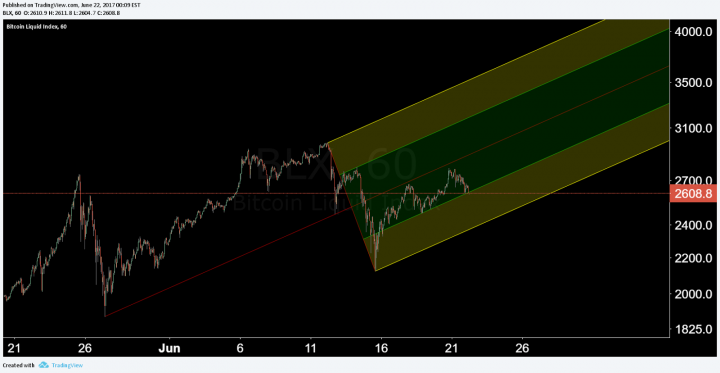
As long as price remains in the Pitchfork, the lower yellow boundary is considered a buy. The median line should be a high probability target from that zone. To further visualize how this might play out, look to the Pitchfork established from the March high and low. Should price fall out of the current Pitchfork, expect price to find support on the previous Pitchfork.
Conclusion
Any compromise or solution to the block size and scalability debate should be welcomed by the entire community. All sides of the debate have essentially agreed that SegWit will be a step in the right direction. Despite the SegWit2x agreement, users remain concerned about a hard fork, which has not been coded or tested. Worldwide demand, interest, and growth continues, with India becoming the most recent country to begin regulation surrounding Bitcoin and Bitcoin companies. After a 20% news driven correction, price has erased those losses, with technicals showing a price structure suggesting $3200 in the near future. Look to the Ichimoku Cloud on the four hour timeframe and the most recent Pitchfork for support and resistance targets.
Thanks For Reading if you enjoyed Upvote and Follow Me @koolkj