Well, unfortunately, supply pressure does not decrease, and what is worse is rising !!!
The bear cubs are building a new ceiling at $ 9,200 and it starts looking the same as it did a few days ago at levels of around $ 10,000.
Aggregated Heatmap (BTC / USD) is starting to show a thick plume again at the level of $ 9200, which begins to change color exactly as before. The BTC price bounces from this place over and over again, without the option to buy as many sales orders.
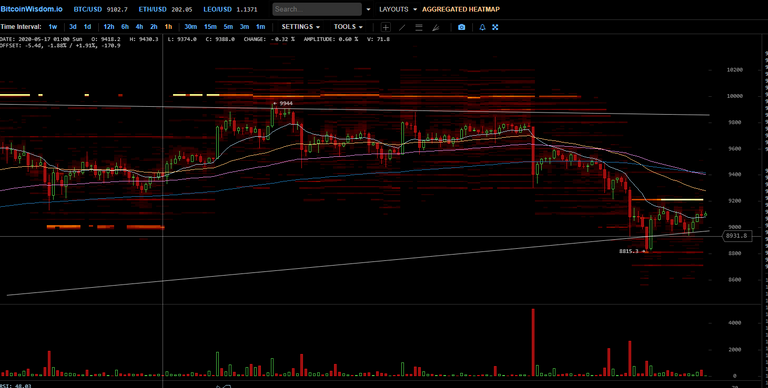
Aggregated Heatmap (BTC / USD) are order books from all major exchanges, such as: Binance, Kraken, Coinbase, Bitfinex, etc., but we must remember that there is also the whole leveraged and futures market, which is not visible here and affects the price , I do not know, or not more than the spot markets themselves?
If this is true, some early miner moves / liquefies its capital, then it chose the most suitable moment for it, when the price reached the highest level, but did not break historical resistance, which may indicate a trend reversal, especially since we have . "dubbel top".
Warning! This user is on our black list, likely as a known plagiarist, spammer or ID thief. Please be cautious with this post!
our discord. If you believe this is an error, please chat with us in the #appeals channel in