*We're always around to be of help in all things crypto and blockchain :)Join our Telegram group - https://t.me/joinchat/GXO2tBJ1TWgm0AHo9d4Scw
BTC is currently at spot #1 in terms of total market capitalization.
At the time of writing, BTC price is currently sitting at $6370 after some decent retracement since yesterday.
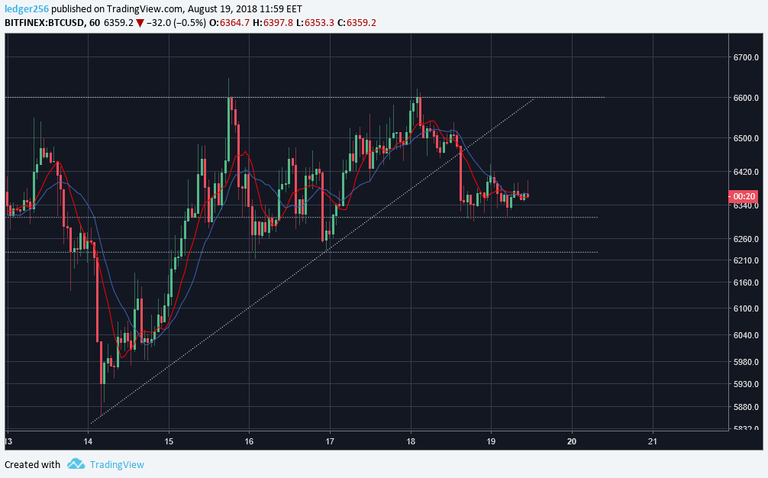
If you recall, yesterday we mentioned that IF we took that chart pattern to be an ascending triangle, BTC needed to make a move one way or the other before it completely fills. And it did!
Looking at the 1H chart, we can see that BTC broke the dynamic uptrend it had previously formed and thus invalidated the ascending triangle pattern. However, by breaking down, it also found new temporary support in the $6300-$6310 range. Unfortunately though, as it has been the case over the past week, it looks like it's just gonna be more ranging for now. However, on the downside, we'd look to see if BTC can hold the $6310 support it looks to be forming (perhaps a couple more tests are in store for us), but if that doesn't hold, we'd look at $6230 next. Below that, though, and it's really no-man's land; will it bounce back again after reaching $5900? Will it go below July lows? No one knows.
On the upside, and since testing of resistances seem to come in threes these days, we'd look to see if BTC can gather enough momentum to retest the $6600 resistance it has been struggling, although now would be the third time. If it breaks through that, we'd be looking at $6800-$6900 next. HOWEVER, that being said, note that there is a ton of money looking to short at exactly $6650 and $6700, so we might see a fake breakout to these levels and then a hard rejection following that.

On the daily chart for BTC, technical indicators are almost unchanged from yesterday and give a bearish outlook (14 sell, 10 neutral, 2 buy)
On the weekly chart for BTC, technical indicators give a slightly better outlook but still bearish overall (12 sell, 9 neutral, 5 buy)
Our medium-term level to monitor for a potential signal of another rally is still$7200. We still maintain that the level to watch over the short to medium term on the downside is around $5750.
As always, if you have any questions, don't hesitate to reach out via email or through our Telegram group! (links below)
\
How to get in touch with us:
Follow us on Steemit - @ledger256
*We're always around to be of help in all things crypto and blockchain :)Join our Telegram group - https://t.me/joinchat/GXO2tBJ1TWgm0AHo9d4Scw
Email us - [email protected]
DISCLAIMER
NO FINANCIAL ADVICE – The information on this blog is provided for education and informational purposes only, without any express or implied warranty of any kind, including warranties of accuracy, completeness, or fitness for any particular purpose. The information contained in or provided from or through this blog is not intended to be and does not constitute financial advice, investment advice, trading advice or any other advice. The information on this website and provided from or through this website is general in nature and is not specific to you the Reader or anyone else. You should not make any decision, financial, investment, trading or otherwise, based on any of the information presented on this blog or any affiliated channel without undertaking independent due diligence and consultation with a professional broker or financial advisory. You understand that you are using any and all Information available on or through this website at your own risk.
RISK STATEMENT – The trading of Bitcoins and alternative crypto-currencies has potential rewards, and it also has potential risks involved. Trading may not be suitable for all people. Anyone wishing to invest should seek his or her own independent financial or professional advice.
Very usefull analysis!