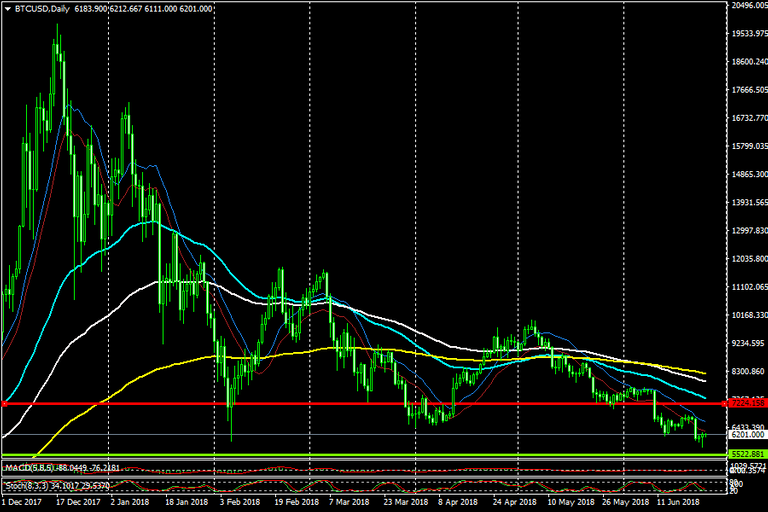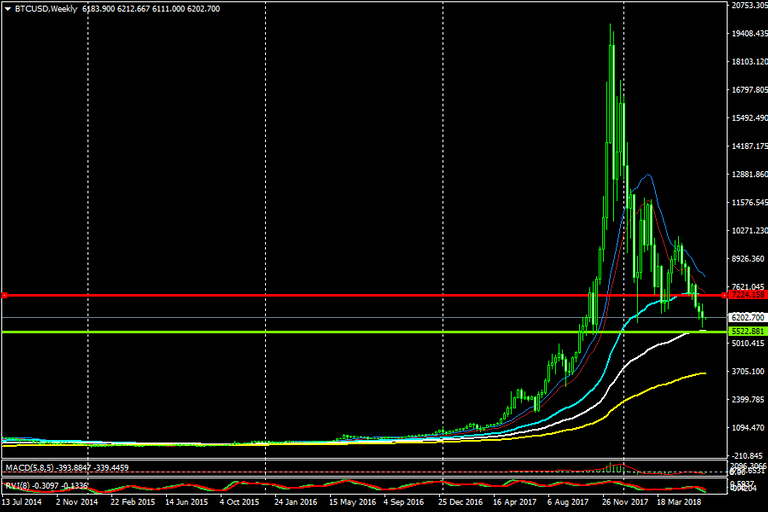
Bitcoin is in bear trend since early 2018 and it is still in the bearish consolidation phase but the overnight rebound of BTC yesterday once again confirmed that 5500-5900 range is really a great support, because it was the same level where it had got support earlier also and this time also we saw 400 pips rally so far this morning. 5500-5900 is a level we should look for buying bitcoin with a tight stoploss at 5400 or 5200, because the breach of 5500 support will take bitcoin all the way to 3600 level.
Based on moving averages now the 200 moving average is going to be the tough resistance and in intraday trading any rise of Bitcoin is likely to be capped at around 6350 region as shown in the H1 chart.

In the H4 chart the major resistance lies at 6844 but if Bitcoin conquers this level then the next hurdle will be 7200 which is really the major resistance not just in H1 and H4 chart but also in D1 and W1 chart also.
However the overnight rally of 400 pips suggesting that Bitcoin is preparing that ground to make this rally to remain sustainable at least upto 7200, however the same may not happen in a day or two and it will take couple of trading sessions to test 7200 level. Above 7200 level, the next hurdle will be 7700 followed by 9000 level.

In the daily chart, there is a formation of bull candle, however we need follow through candle to confirm the reversal of trend and other indicators should also have to be checked to confirm a reversal and it is too early to say that a bottom is in place but in near term, BTC is likely to trade in the range of 5600 to 7200 as long as it finds support in 5500-5900 level.
The confluence of moving averages in the daily charts says that we are still in bearish phase, because BTC is trading well below 55, 100 and 200 moving averages and the first resistance which is 7200 level is also intersecting with 55 MA, hence 7200 is going to be tough resistance for Bitcoin for the time being.

Now in the weekly chart as shown above, there are two lines (Red and Green), Red line is now the resistance and Green line is support.
Red Line - 7200
Green Line - 5500
In the weekly chart the price action of Bitcoin broke down the 55 MA and now testing the 100 MA which should provide some sort of support and is not likely to breach at one go and that is why I am saying that from here the price action of BTC will try to test the next resistance which is 7200 and then again the 100 MA might be tested and if that holds then we can say that a bottom is in place and if the 100 MA breaks then BTC is all set to test the 200 MA which now lies at 3600 level in the Weekly chart. 3600 level is also a very very significant level and may prove to be the multi year support for Bitcoin and it may be tested in future.
Bitcoin is going to 4500 and in July we all will see this level and that's the truth. Whatever goes up comes back and this is the cycle.
Thank you...steem on and stay blissful...
Congratulations @littymumma! You have completed the following achievement on Steemit and have been rewarded with new badge(s) :
Click on the badge to view your Board of Honor.
If you no longer want to receive notifications, reply to this comment with the word
STOPCongratulations @littymumma! You have completed the following achievement on the Steem blockchain and have been rewarded with new badge(s) :
Click on the badge to view your Board of Honor.
If you no longer want to receive notifications, reply to this comment with the word
STOPDo not miss the last post from @steemitboard: