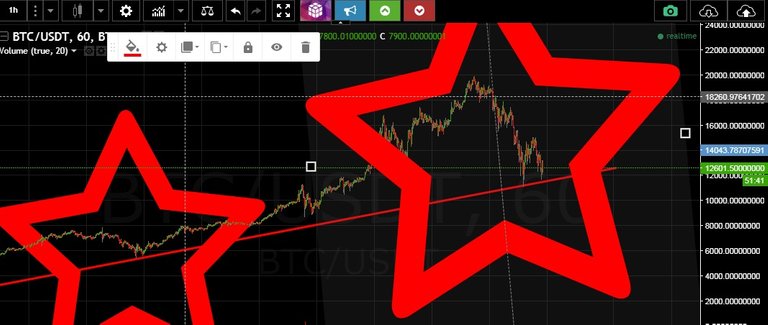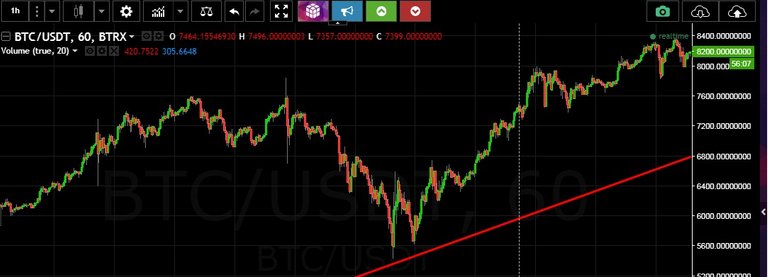
We had a nice bounce back from 5.4K$ on 11/11. Many professional traders predicted 5000$ or even just under as their targets. It never came back down. Note how the market wanted to go to a lower target before taking off.

I bought a little amount of btc for under 6K at the first dip on 11/11, but had most of my fiat waiting for us to fall under 5K. The exact same thing is happening now!
This time I feel many people want the 10K resistance to be tested, and it has just missed it once again. We are once again down, trying to see if btc is going lower... but I feel the pattern is repeating.
There is even a little correction in the middle that looks the same, just on a higher trend.
Not trading advice, just interesting pattern. Hope it will hold.
Cheers!
I hope you're right! If not, I'll take advantage of the holiday discount.
I Hope so too, I am investing to buy some mining rigs next year.
Bought a small amount on the dip the other day, but then was holding most of my cash to buy under 10K. This made me realize the same thing has happened before.
Good Luck!
It looks like we've been getting closer and closer to that point. I've seen other charts where we've fallen right below support at 12,800 but have bounced back.
For the most part it seems like there's significant sell pressure around 15,800 (Was watching charts today). A move was made, but around that point, sellers just knocked the price down.