🐒 USERS ONLINE 
🐒 ONLINE USERS AT POLONIEX BITCOIN PRICE correlation I started collecting data on online users at poloniex . I try to collect the data about the same time every day. I was thinking it would be interesting to see how the amount of users increase or decrease with the Bitcoin price .
🐒
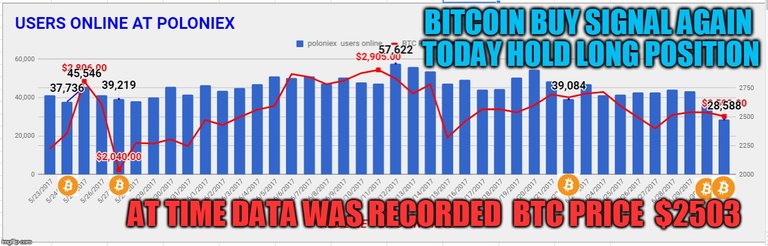
BLUE COLUMN = USERS CURRENTLY ONLINE AT POLONIEX AT TIME DATA WAS COLLECTED
RED LINE = BITCOIN PRICE AT THE TIME DATA WAS COLLECTED
SUMMARY
🐒 I may have isolated a possible chart pattern showing the possibility of Bitcoin rising in price . The pattern works like this when Polinex users ( Blue Column ) fall below 40,000 we can look for a rise in Btc price over the following 24hr . I have placed a Bitcoin symbol at bottom of chart to show when this has occurred. And this has happened now 3 times and so far it has worked 3 for 3 for BTC to rise in price over the next 24 hr's when users fall under 40,000.Below are the results of using this Buy pattern.
BITCOIN BUY PATTERN
| DATE | BUY PRICE | SELL AFTER 24HR | PROFIT / ( LOSS) |
|---|---|---|---|
| 5/24/2017 | $ 2357 | $ 2806 | $ 449 |
| 5,27,2017 | $ 2040 | $ 2273 | $ 233 |
| 6/22/2017 | $ 2668 | $ 2700 | $ 32 |
| 6/30/2017 | $ 2537 | $ |
🐒
DISCLAIMER : This content is for informational, educational and research purposes only.
Please get the advice of a competent financial advisor before investing your money in any financial instrument.
It is strongly recommend that you consult with a licensed financial professional before using any information provided here . Any market data or news commentary used here is for illustrative and informational purposes only.
Please voice your opinions in the comments below..
🐒
🐒 ONLINE USERS AT POLONIEX today 28,588 THIS IS A NEW LOW
🐒 BUY SIGNAL AGAIN TODAY FOR BITCOIN and SELL IT TOMORROW MORNING Bitcoin price was $2503 at the time I recorded the data I will be holding my long position if the users are still below 40,000 in the morning I will continue to hold until the users are back above the 40,000 at the time I record my data.
DISCLAIMER : This content is for informational, educational and research purposes only.
Please get the advice of a competent financial advisor before investing your money in any financial instrument.
It is strongly recommend that you consult with a licensed financial professional before using any information provided here . Any market data or news commentary used here is for illustrative and informational purposes only.
I'm holding and I also see a buy signal was issued by your 24hr volume comparison I'm all in with my trading dollars
Nice post! 👍
Nice idea! But personally I'm not sure if this correlation is really strong enough... :/
.
Thanks information..
Great project..
Upvote and Resteem @me
Always enjoying your insights :)
An interesting pattern. I shall look into the data and try to see if we can find more such patterns and use it make some money. Well done.
Soon it go up... just wait.