Speculation of the day 06/27/2017
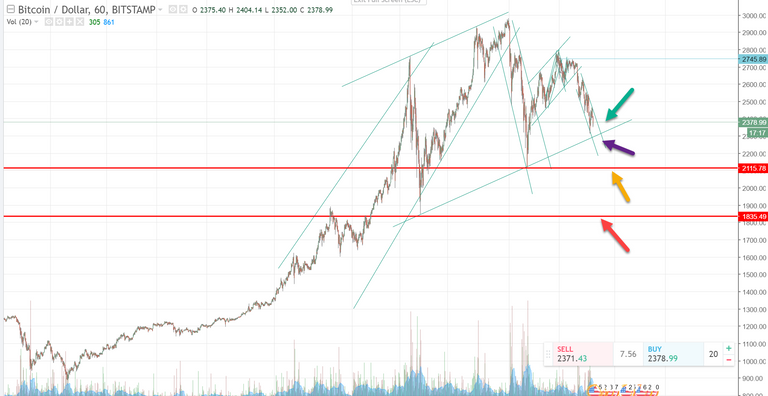
Things could get really interesting this week for Bitcoin/USD. Bitcoin has been in a downward channel since it broke out a few days ago and is now about to reach a critical larger trend line. Few possibilities:
- Green arrow - it breaks out of the downward channel and starts an upward channel.
- Purple arrow - it breaks through that trend line at around $2300 and continues the free fall.
- Yellow arrow - if it breaks through the trend line the purple arrow points to, this first red line should be a support area ($2115) If it falls through here, it will then be tested again...
- Red arrow - second test at $1835. If it doesn't bounce off this support level, we'll see $1700's and maybe even lower.

some good info there but even if this does happen it is already up from the beggining of the year say it even goes to $1500 then so be it but it will always rise back up. reason being it is constantly getting mined and more people are adopting it especially when the price drops you would think it is a good chance for people to buy, therefor more adoption therefor higher price. just my view on it, thanks for your post
I'm bullish Bitcon for the long run, but I like to speculate on the short term. I would love to see it at $1500 - I would consider that a great buying opportunity.
i agree. lets see what happens come end of year - my predicition is ethereum at $1000 and bitcoin $3500 personally
Just got this alert around 12:44 PM EST 06/27/2017 Bitcoin broke through the trend line that the purple arrow points to...
Could just be a test of the trend line. We'll see shortly.
Looks like it was a test of that bigger tend line - the candle bottom shriveled right up - lol. Just got another alert that the upper channel line was broken. We'll see if that's a test or if it's a real breakout that we pointed out as a possibility with the green arrow.