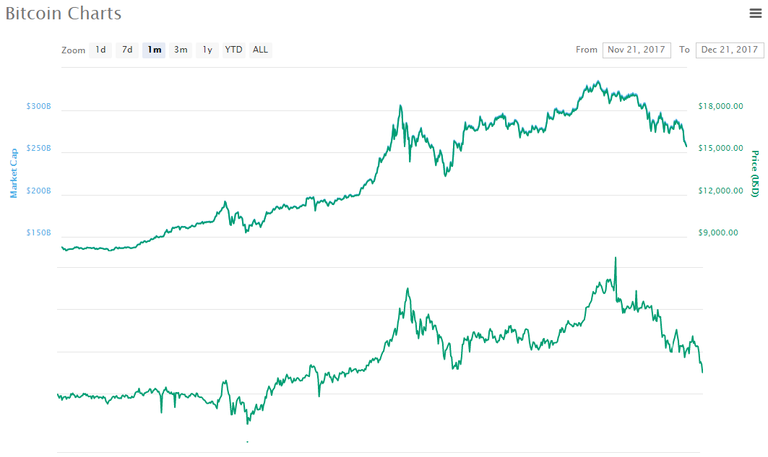
Been noticing this for awhile and I know why, but just crazy to see how close these graphs are for a 30 day window.
Anyone want to take a shot and try to guess which coin the bottom graph represents?
Top graph is Bitcoin: (Side note - the bottom graph price is not identical to bitcoin, just the graph movement is identical.)

~nX
I have a feeling the bottom graph is BCH?
Nope not BCH. If you think about it hard enough you'll probably figure out the coin without having to rummage through graphs for hours :P
Hah, I have no clue, the pricing on the right shown nearly $9k and I don't know of a coin that hit that?
ahhh my fault. The pricing isn't identical to bitcoin, it's just the fluctuation in the graph is almost identical. I'll give you one more guess since I didn't explain that properly...then I'll tell you the answer :P
If the price is wrong, then I think it is Bitconnect Coin?
YES sir! lol nice work
Thanks! I so far have been pleased using Bitconnect.
you always have great content