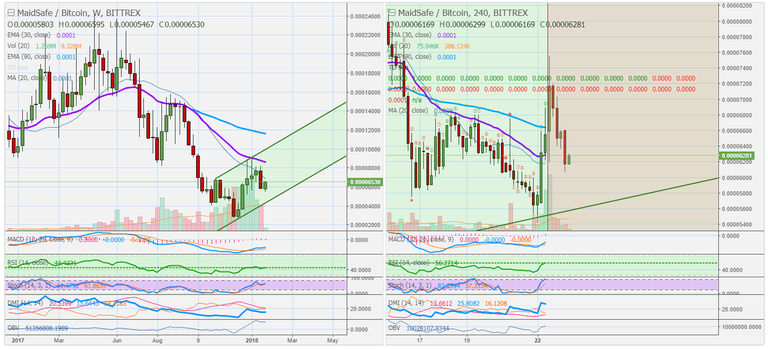
I've been looking at MAID for quite a while, this is a coin recommended by everyone basically and when you look at the charts, this is a coin that is never lacking action. Even with the market-wide correction, MaidSafe is showing good potential for a nice run.
Let's look at the charts and see what this cryptocurrency can do for us in these calm, relaxed and completely tranquil days. Remember that we are on a market wide correction, so be careful with this and every other trade.
We are going straight into the action, the take off already happened, the price is going up. But remember that we are holding strong, every single one of our trades, even ignoring the stop loss. Use new money to buy in and hold for long.... here we go.
MaidSafe (MAID) Trade Analysis by Alan Masters
Instructions
We go straight into the action as I know some of you are missing my (our) trades. Let's do this, I've been missing them as well.
Buy-in: 0.000062 - 0.000080
Targets:
(1) 0.000100
(2) 0.000160
(3) 0.000190
(4) 0.000240
(5) 0.000310
Stop-loss: 0.00005399
The stop loss can be really useful this time. If you don't want to hold through the correction, if things go sour, then the stop loss can help you, but MAID has been holding strong at the current levels and it can go up according to the charts, let's look at the indicators.
Indicators
- MAID bounced really strong from a true bottom on the 11th December. I say true bottom because this coin has never seen anything lower than that. So it isn't a recent bottom but the true bottom (based on the Bittrex BTC -5.21% chart on Trading View). After this bottom was reached, a bounced happened and an uptrend has formed, the price has been going up since, even the correction didn't do much to thwart the growth of this coin. So we want to join in, we want to profit from this trade.
- On the daily chart , we can see that MAID had a strong bounce today, after reaching a bottom for the day the price has increased by 20%, this is a huge take off. This caused the indicators to start giving positive signals and there is still plenty of room for growth.
- The weekly chart is where the action is, we have all of our most appreciated signals coming from the chart and indicators, let's give them a quick look: MACD and RSI are both curving and pointing upward, with plenty of room for growth.
- The STOCH and OBV are also on the bullish zone.
- We are in a clear uptrend trading on an ascending channel . And after a bad week last week, this week can turn into consolidation, to then finally take off.
Source: Tradingwiev/alanmasters

Nice. Upvoted. Please upvote.
Thank u bro.
@originalworks