The bitcoin market isn't a normal one. I seem to think its been accounting for inflation through all these moves. See the following charts for a pattern that keeps presenting itself. This is pure technical analysis but it agrees with fundamentals and psychology. I'm not an expert so take this as my opinion.
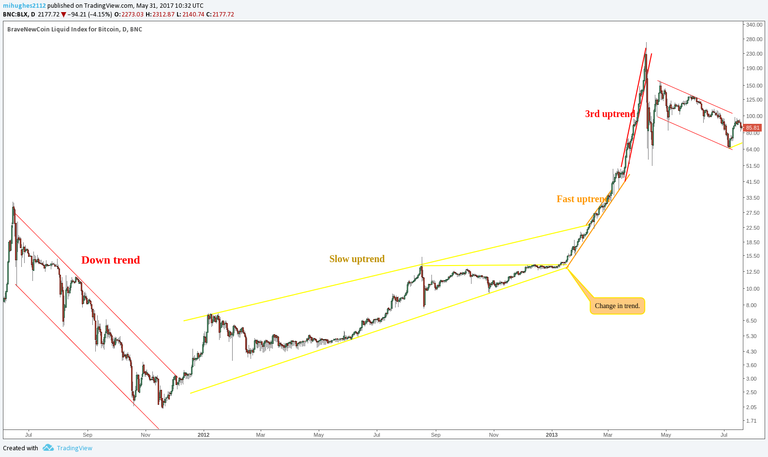
2012 $1-$100
This was 2012 from $1-10, $10-50, $50-100. Then downtend.
 https://www.tradingview.com/x/GeyH2sWr/
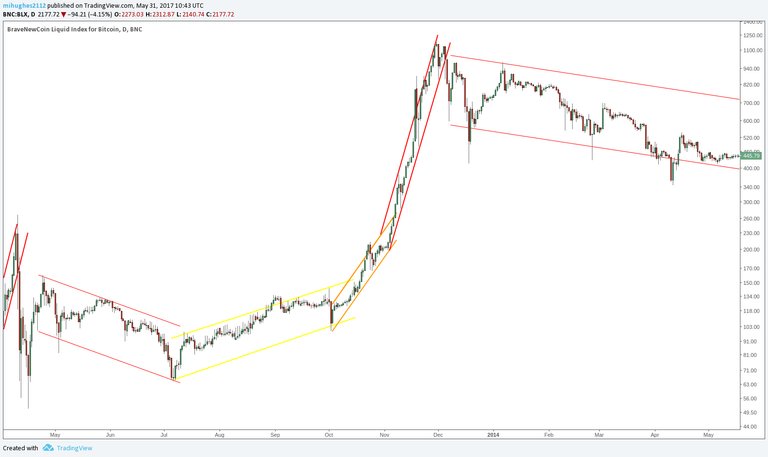
2013 $100-$1000
This was 2013 downtrend from $100+ to $60. Then from $60-120, $120-200, $50-1100.

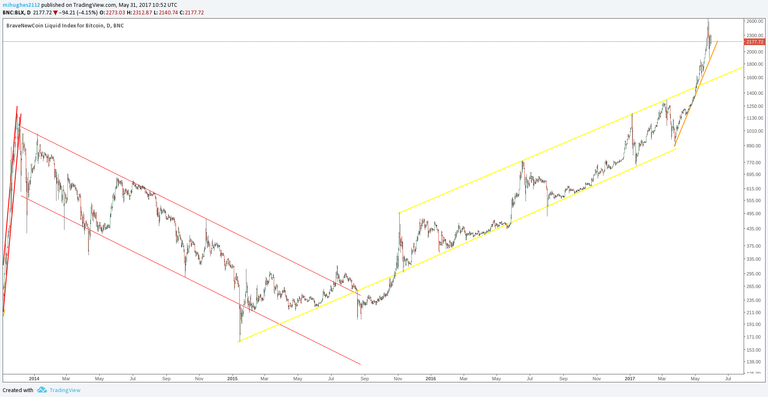
2016 $200-$10,000+?
This was the 2014 bear market from $1000+ to $200. Then from $200-1000, $1000-2000. Here's the picture now. We either go back into yellow channel or create steep red channel. No red channel yet with my rule set or manifestation in price.
 https://www.tradingview.com/x/1YqUgthh/
Very unlikely bitcoin will enter a bear market, worst case BTC re-enters the lower 2016 to 2017 yellow channel, with price at $1700 to $2800 by 2018. If it repeats the pattern however price is much higher.
Further Analysis
I'll now do some time and price analysis to get predictions soon. Why not post your prediction for the end of the year below.
good charts
What about the steem boost? :)
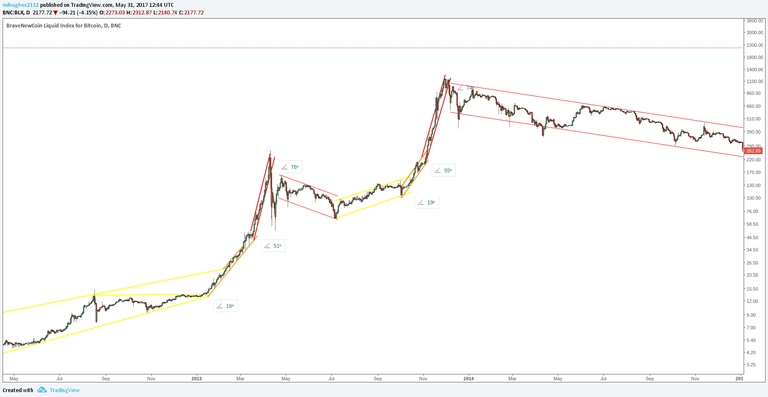
Extra bit:

The angles are very similar in each stage