Look at the weekly stochastic RSI - It is as high as it was at the last ATH.
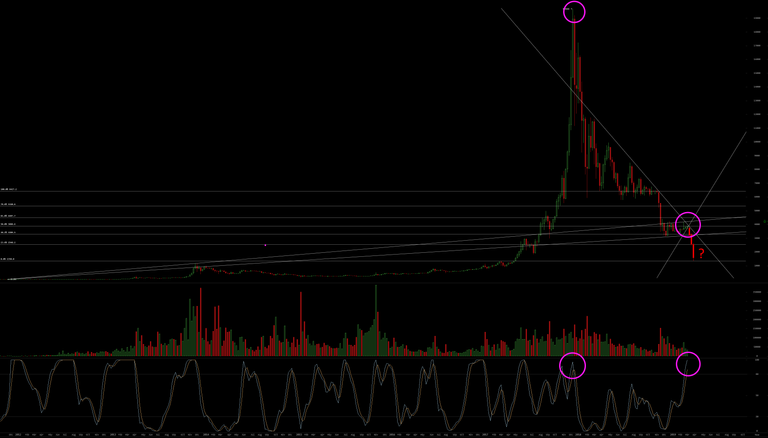
When we draw Fibonacci lines from the top of the big drop last year on 7 November 2018 at 6544, and put the current level at 50%, we see we arrive near the 1350 High of 10 March 2017 at 100%.
If this sideways market is nothing but a descending triangle that is now closing, then one of these days the big dump can happen any moment now.
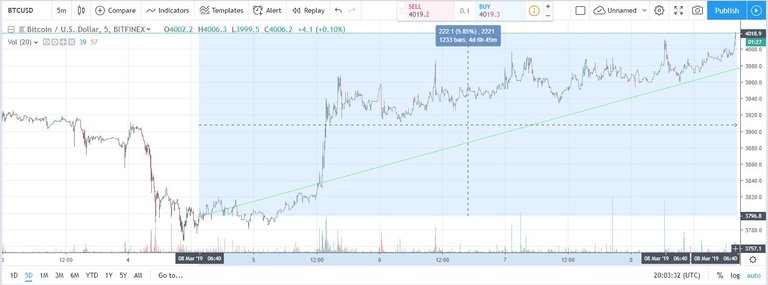
I was looking for a bounce up first above 4K, but this momentum seems a bit exhausted at the moment. So, though a bullish "fake out" is still possible, we might just as well dive in the crypto abyss, today or tomorrow or on monday...
I closed all my long positions and decided to short and will add to my shorts if we climb higher.
And when we do dump below the 200SMA ...


one day pump and another day dump hahah
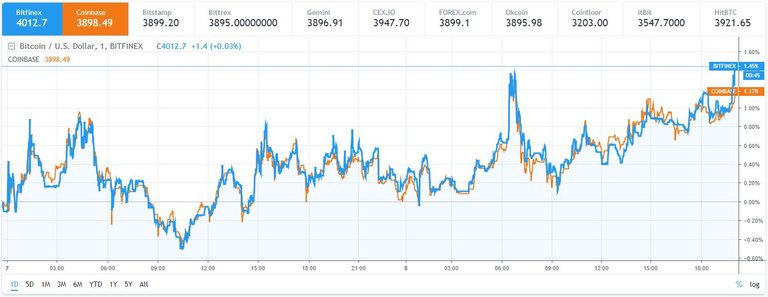
Continuing up since 4th this month when took a day of rest. Now prediction of 4200 within 3days