Since Bitcoin started mooning last November we have witnessed it perform almost identically as it did so back in November 2020. The vertical pattern into a new ATH continued through to the end of December 2020 then, almost mirroring the pattern of 2024.
However, we are nearing the end of February and have almost two months of completed price data for 2025 to compare with January and February 2021. I have to say it's not looking as strong a picture at this stage of the game. Take a look at where Bitcoin was at the start of January 2021.
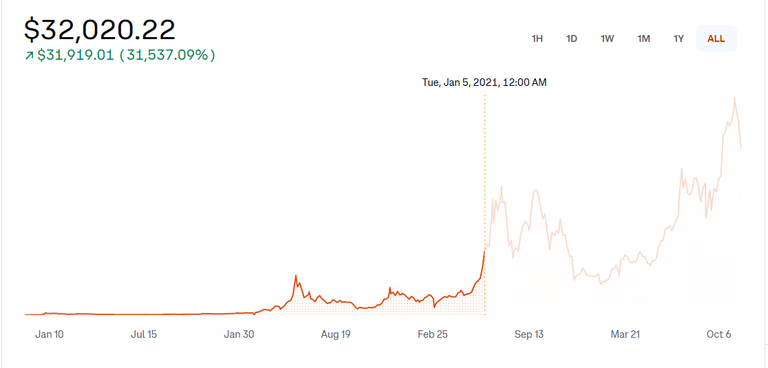
(Coinbase.com - Bitcoin price as at 5/1/21)
We can see that the vertical movements of the preceding two months continue into January 2021. Take a look at the next graph and we can see how Bitcoin was performing on today's date four years ago.
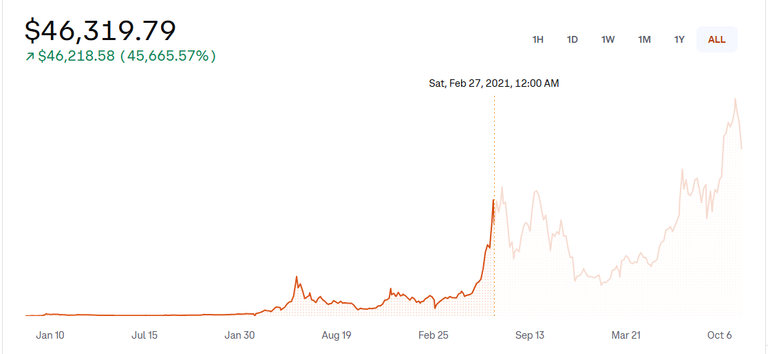
(Coinbase.com - Bitcoin price as at 27/1/25)
Clearly we witness Bitcoin surging and hitting a new ATH of just over $46,000. Obviously this is not the same pattern happening with Bitcoin this time round. Yes the price is clearly higher now than four years ago but the vertical pattern that we saw back at the start of 2021 is not repeating now four years later.
Why this is occurring is difficult to say. We have never seen so much interest and involvement in crypto from fresh investors, individuals, corporates, governments etc. Combined with a crypto friendly US administration there is a lot going for crypto right now, far more than at any other time in its history I would say. But as yet this is not reflected in Bitcoin price, and indeed the price of altcoins. As we know a much needed altseason still eludes us.
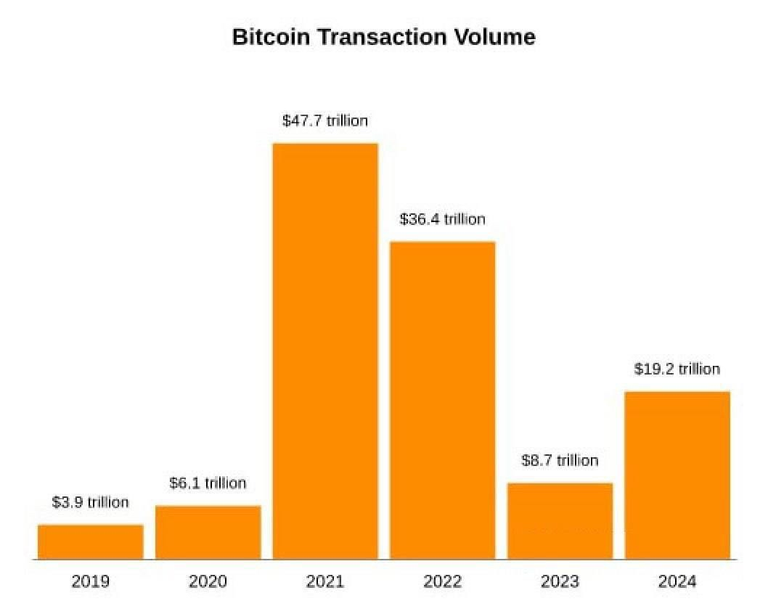
(Source: Cointelegraph.com)
Take a look at the Bitcoin transaction volume over the years and we see a huge bar for 2021, the last great bull run. Will there be a repeat performance this year? If we consider the Bitcoin transaction volume for 2020 and compare that to 2024, while difficult to draw a direct parallel, it's clear we were moving in the right direction with a total of $19.2 trillion Bitcoin transactions, three times more than in 2021.
The correlation between Bitcoin price and transactional volume might just give us some clues as to where things are going. Last year was a good year for Bitcoin transactional volume and price, in terms of pattern mirroring 2020. But will that increase in transaction volume of 2024 continue to increase in 2025 so Bitcoin can pump again? And more importantly will it be enough to trigger an altcoin season?
Peace!