Bitcoin price extended gains and traded above $6900 against the US Dollar. BTC/USD now eyes a test of the all-important $7000 handle.
SPONSORED ARTICLE:  Tech Analysis articles are sponsored by SimpleFX - Simple as Never Before,
SimpleFX is a robust online trading provider, offering trading with Forex CFDs on Bitcoins, Litecoins, indices, precious metals and energy. Offers simple and transparent trading conditions.
Key Points
Bitcoin price continued to move higher and traded above the $6500 level against the US Dollar.
Yesterday’s highlighted ascending channel with resistance at $6522 was broken on the hourly chart of the BTC/USD pair (data feed from SimpleFX).
A new all-time high was formed at $6909 from where the pair started a correction.
Bitcoin price extended gains and traded above $6900 against the US Dollar. BTC/USD now eyes a test of the all-important $7000 handle.
Bitcoin Price Bullish Trend
Yesterday, we saw how bitcoin price was preparing for more gains above $6400 against the US Dollar. There was a solid upside move and the price was able to break the $6500 resistance to trade above $6900. A new all-time high was formed at $6909 from where a short-term correction was initiated. The best part was the fact that there was a break above yesterday’s highlighted ascending channel with resistance at $6522 on the hourly chart of the BTC/USD pair.
At present, the pair is trading near the 23.6% Fib retracement level of the last leg up from the $6282 low to $6909 high. On the downside, there is a new connecting bullish trend line forming on the same chart of BTC with current support at $6680. The 38.2% Fib retracement level of the last leg up from the $6282 low to $6909 high is also positioned near $6669. Therefore, the $6680-70 levels are decent supports in the short term.
The most important support is near $6600. It is near the 50% Fib retracement level of the last leg up from the $6282 low to $6909 high. On the upside, the pair might attempt a break above $6900 for a push towards $7000 in the near term once the current correction is complete.
Looking at the technical indicators:
Hourly MACD – The MACD is strongly placed in the bullish zone.
Hourly RSI (Relative Strength Index) – The RSI is well into the overbought levels, pointing a short-term correction.
Major Support Level – $6600
Major Resistance Level – $7000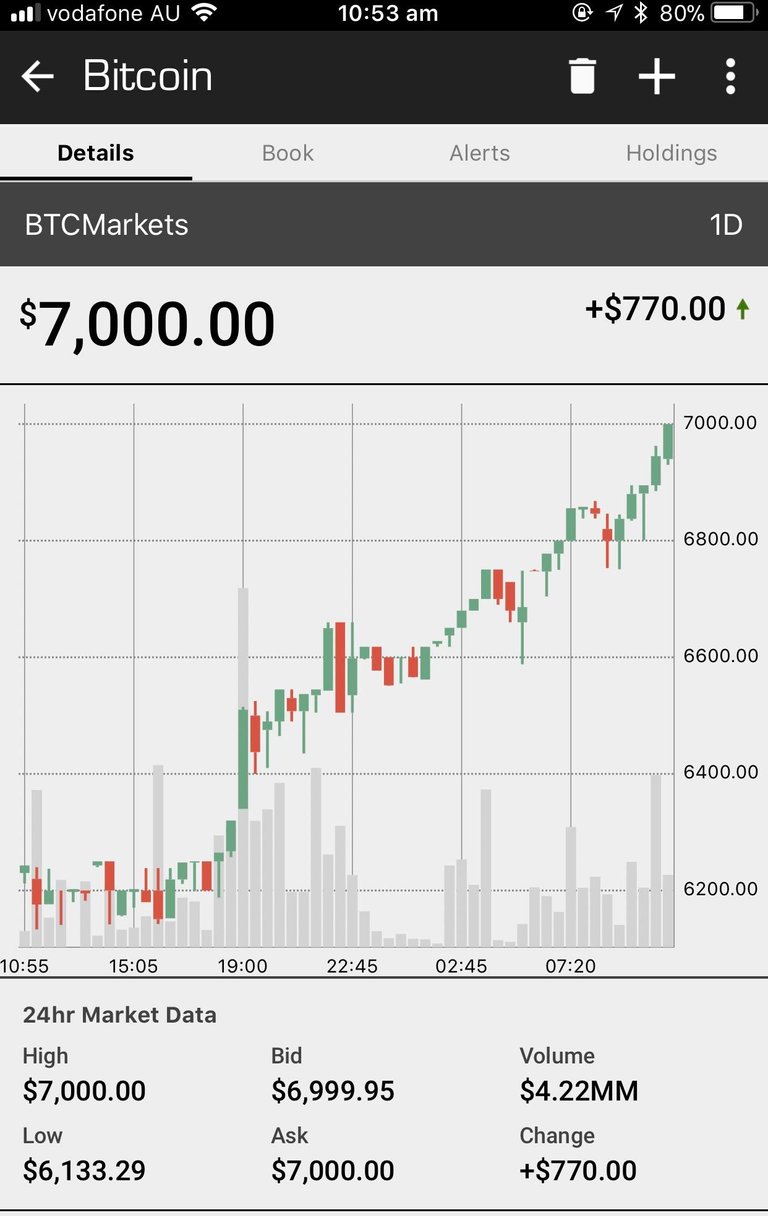
Hi! I am a robot. I just upvoted you! I found similar content that readers might be interested in:
http://bitcoinmining.shop/bitcoin-price-technical-analysis-btcusd-wants-a-piece-of-7000/