
General Tone: In consolidation phase.
Indecision and difficult wave count. We see more bearish signs than bullish,
but I remain 100% neutral.
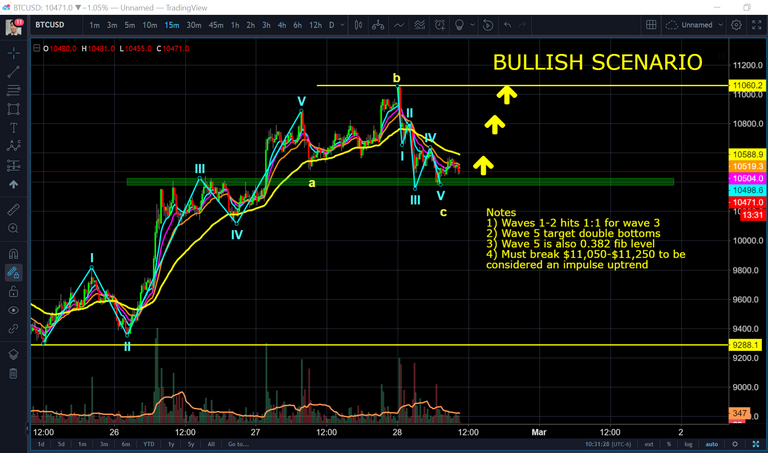
Lower range support is $10,150.
Must break about $11,250+ to be bullish
Long Term Bias (6+ months) - Bullish
Medium Term Bias (Next Week) - Neutral
Short Term Bias (Today) - Neutral
Long Term Target Prediction - Primary Wave 3, $35,000+ by 2019

My Comprehensive List of Tutorials
Please consider upvoting if it has helped you
Please consider purchasing me a 33 ft' yacht
if you have reached incredible success
Lesson 1 - Bitfinex Tutorial - How to Customize and Set Up Bitfinex
Lesson 2 - How to Analyze Candlesticks Charts with Strategy
Lesson 3 - Moving Averages
Lesson 4 - Relative Strength Index RSI with Advanced Strategy
Lesson 5 - MACD and Histogram
Lesson 6 - Margin Trading Long, Shorting, Leveraging
Lesson 7 - Basic Risk Management
Lesson 8 - Fibonacci Retracement Part 1
Lesson 9 - Fibonacci Extension Part 2
Lesson 10 - Laddering
Lesson 11 - How To Interpret Time Frames
Lesson 12 - Swing Trading Advanced 55 EMA Strategy
Lesson 13 - Introduction To Elliot Wave Theory
Lesson 14 - Using a Basic Excel Tracker for Risk Management
Lesson 15 - Automatic Stop Sell/Buy Executions
Lesson 16 - Advanced 55 EMA Strategy with Time Frames and MACD Part 2
Lesson 17 - 6 Hours Live Trade Scalping. Growing $2,000 Account into $3,500
Lesson 18 - Bitcoin BTC Feb 6 - BTC Update - Summary of ABCDE with live play.
Lesson 19 - Elliot Wave Theory, Fibonnaci Retracement & Extension (Combined with Feb 11 BTC TA)
Lesson 20 - Advanced Elliot Wave WXY With Feb 11 Technical Analysis
Lesson 21 - Using Elliot Wave, Fibonacci, And Extensions To Obtain Targets (Combined witFeb 11 BTC TA)
Lesson 22 - Risk Management, Channels, Fib Retracement, Fib Extension. Summarizing Feb 11 BTC
Lesson 23 - Fibonacci extension, Fibonacci Retracement, Elliot Wave, Shorting, Playing Downtrend - Summarizing Feb 21 BTC + ETH
Lesson 24 - Customize RSI Alerts & Multiple Charts, Pro Features of Trading View
Twitter - https://twitter.com/PhilakoneCrypto
Youtube - https://www.youtube.com/user/philakone1
If you think I've helped you tremendously, donate crypto to my dog's tequila / vodka problem.
BTC: 3FYAk7kMXP21S2hFvr7GrANAEDwxknCjCS
NEO: ANNmGUDAoFZs52dEkckQoL1vw34sxiV4Ey
EOS: 0x4236637ec78f4a9a4627d52829a68cdc6eb292a7
Ethereum: 0x4236637ec78f4a9a4627d52829a68cdc6eb292a7
LTC: LPHXW5WGSSES6RkZ9VXQe76YdLPCUWH1Ev
Bitcoin Cash: 1MaR7nSeVTbu894Xf8gLTNK6xvKZ2hNpbx
XRP Address: rLW9gnQo7BQhU6igk5keqYnH3TVrCxGRzm / Wallet: 2640750089
The ultimate goal is to help the crypto community because I think there's a lack of these type of videos. I want to share everything I've learned because knowledge is only power if passed on. These are educational videos intended to teach how to think through thought-out rationalization.
DISCLAIMER:
Legal stuff here. I'm not financial advisor. This is just my opinion that I'm sharing with the community. All information is for yours to process how you wish.
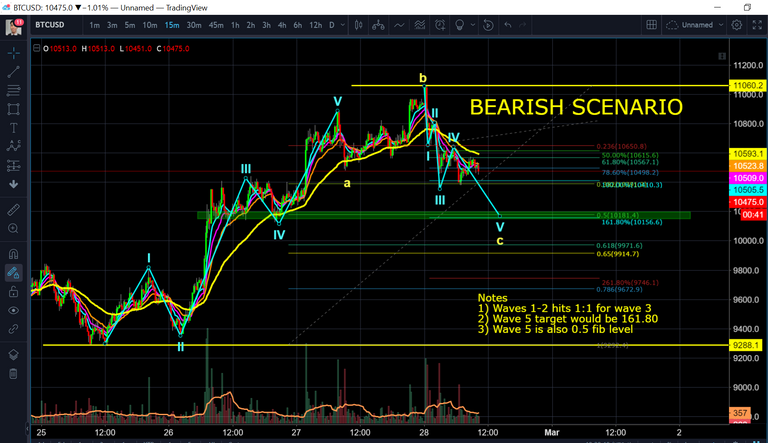
Bearish Scenario
you always say in your videos that W4 can't cross W1 by a wick on a larger time frame (i remember once you said at least 4 hours) in a leveraged market. But here you are letting it extend W1 on a smaller time frame.
Does that mean this is more of a guideline than a rule?
I upvote all your vids, hope you have a chance to reply this time :) Really appreciate all your educational material!
Hi... i still don't get it... please :(
everywhere i read the X waves of double or triple correction are 3 wave ABCs corrections... :(
it is possible for it to be a 5 wave?
If the five waves in the X wave is in the shape of a rising wedge, than it can be considered a abcde corrective structure. Also, wave failures within the X wave can look similar to a five wave.
Right count on top, wrong count in red on the bottom.
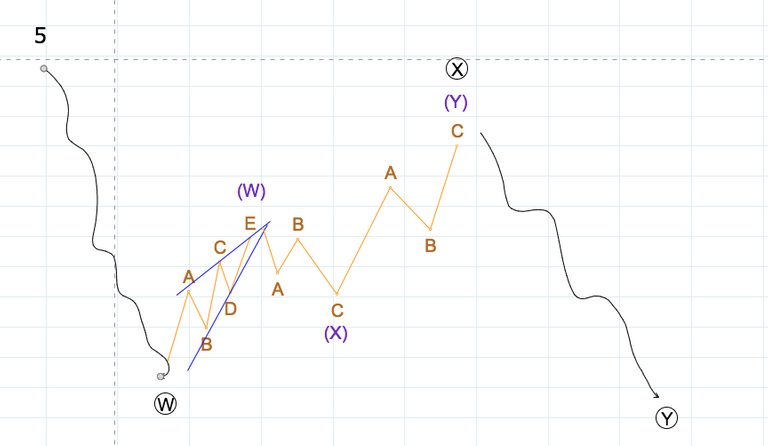
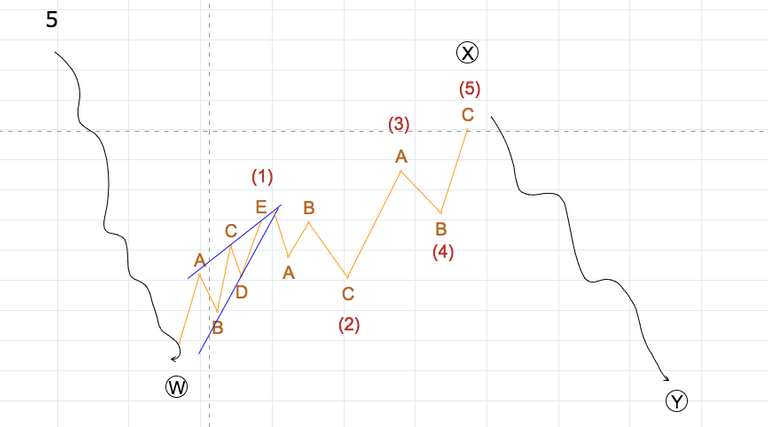
A 5 waves impulse could actually be a corrective wave in disguise. I don't know if I missed any other combinations, but you're right, wave X can't be a impulse.
I have been wondering the same thing since Phil made his last video before he got hacked. Just to make it clear, X is corrective so it takes any corrective pattern, e.g. ABC, but it can also be an ABCDE triangle. But everywhere I read and it seems that 5 wave impulsive (12345) is not allowed in a X.
Please somebody help us...
time to pour some coffee and pull up a chair!
I'm like having this big grin on my face when I watch how your WXY pattern materialize which matches my counts exactly!!!
Wow! If you're giving out grades or gold/silver stars stickers to your student's homework, I'll be very happy to get it knowing that I'm improving over the course.
This is what I tweet on Feb 27 below chart... macro count to match all the small ABC in the B waves, and marking out the X as you describe it should be, spotting the Y ending too :)
Yes, you bet I took trades along the way all the way down and up to that impulse wave up from Y, and also shorting it down! Also those lessons on RSI divergences (see the trend lines I drew below) helps me to enter these long and short trades!
so lovely to have our philakone back!!!
So great to see you back mamma whale! During the 'break' I was going through previous tutorials. Thanks!
hiii :) "break" was horrible :)
gg
This video is amazing. I learned a lot about corrections. Thanks Phil!
Do you do ever check your BTC TA on Bitstamp? I've found that finex tends to get some crazy wicks from time to time due to their margin. For example, the wick that makes the 3rd wave of the latest C wave does not exist on stamp. Without that wick, the C wave makes a very nice completed 5 wave structure that terminates at the current local low of 10364.
Beautiful to see mama whale back with so.e love for the bears!!
lets do a bet philakonecrypto! by 2019 BTC will hit 100k, whats your call? loser buys a bottle of VODKA
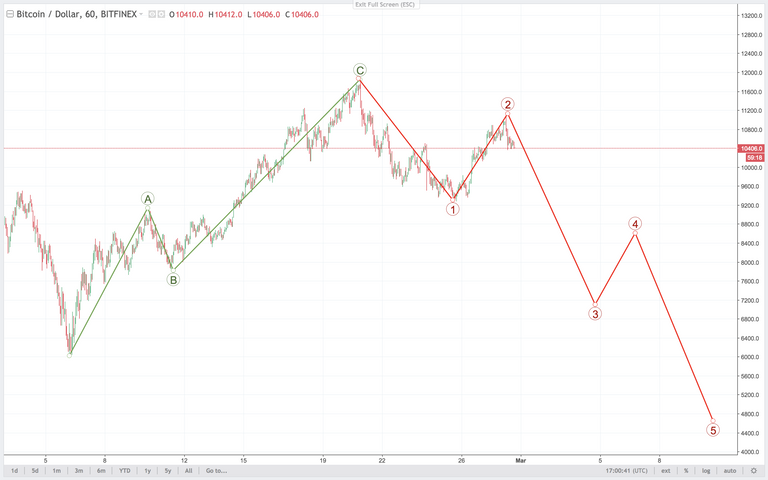
I'm an Elliott n00b, but if you zoom out to the one day chart, doesn't the ABC emerge...?
I think that to validate it you have to count the subwaves within the ABC wave to verify that it is indeed that way. So go to a lower time frame and see if you can find a 3-3-5 or a 5-3-5 structure within that ABC.
I am also a noob, but I don't think you would use a one day chart. Long term use 1hr-4hr chart, phil changes the time frame constantly to verify counts. I just made a post yesterday and I was using the 24 hour chart, I got it wrong cause the first wave was less pronounced with the 24hr chart.
Great to have you back in action!!!!!