TA from a trusted analyst.

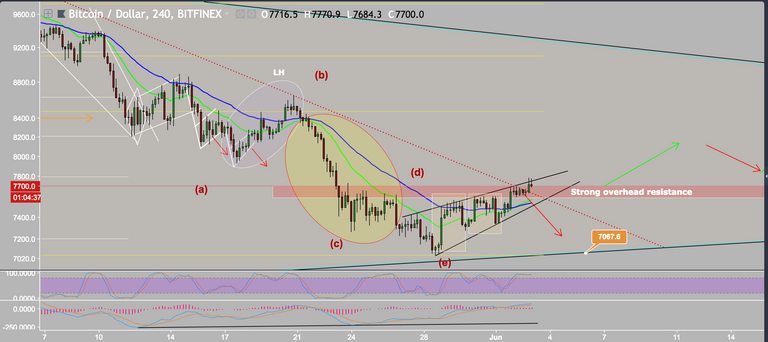
We've got the BTC 4h chart above. As you can see we are struggling to get through the end of this resistance zone listed above by the red rectangle. Depending on how we hold above $7700 over the next few 4h candles, this environment still does not scream short-term bullish to me but we're getting there. We are also struggling to move past the local downtrend channel started from $10k (red dotted line). If we do break past the downtrend channel and resistance zones, your recommended targets are $8000, $8400, $8700, $9000, $9400, and $9900/$10k. Once we do, the stop loss would be right below that same resistance zone (now will be support) ~$7500. The MACD has now created a higher low along with a few swings in the prices but to safely intraday or swing trade we still must get confirmation above $7700. The 40 EMA (blue) being under 20 EMA (green) has provided a short-term buy signal but we cannot ignore the current resistance levels we're facing. I still do believe that we are in a rising wedge and the stoch rsi being high, I wouldn't be surprised if we turned down. But I don't mind being proven wrong in this short-term time frame. I remain strongly bearish in the longer-term time frames until proven otherwise.

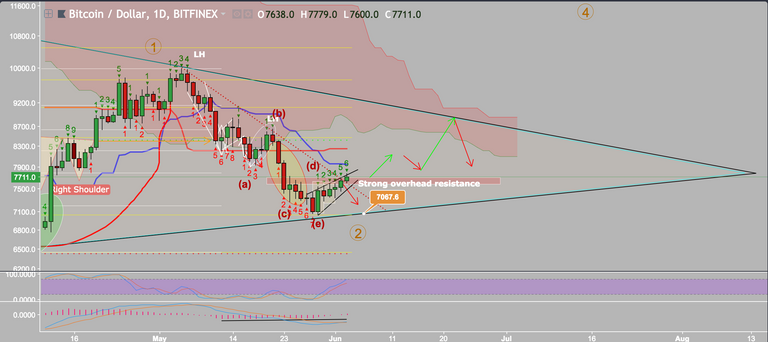
The daily chart is slowly curling bullish for the short-term time frame. However, we are on a green 6 on the TD sequential. If we finish the perfect 9, this would be our reversal sign of price trending down. The 4h chart is giving us short-term bullish signs and now the 1d chart is close to turning bullish. Again, holding steady above the $7700 would be a short-term bullish sign on 4h and 1d chart in the next 12-14 hours. The long-term still shows us creating these lower highs from the top of $20k and I expect this trend to continue until proven otherwise. For this to happen we need to break above $10k first then $12k and then we can be given long-term bullish signs. We are far from that right now.