Bitcoin is rallying today, having bottomed out below the $6,000 mark yesterday.
As of writing, global average prices on CoinDesk's Bitcoin Price Index (BPI) are around $8,120. On Coinbase's GDAX exchange, bitcoin (BTC) moved above $7,944 – the confluence of 200-day moving average (MA) and 5-day MA – earlier today and was last seen changing hands at $8,200
The cryptocurrency has appreciated by 26 percent in the last 24 hours, according to CoinMarketCap. Also, prices are up 38 percent from the previous day's low of $5,947.40, as per the BPI.
Across social media, the sharp rise in BTC is being attributed to the U.S. Securities and Exchange Commission's (SEC) and the Commodity Futures Trading Commission's (CFTC) cautiously optimistic tone set at a Senate hearing yesterday. Investors seem to have taken heart from the fact that members of Congress and the SEC see potential in blockchain technology. Also, industry observers were impressed by the measured and sophisticated nature of the dialogue.
So, it appears bitcoin has moved out of the hot water, and the technical studies seem to confirm that a bottom has been made.
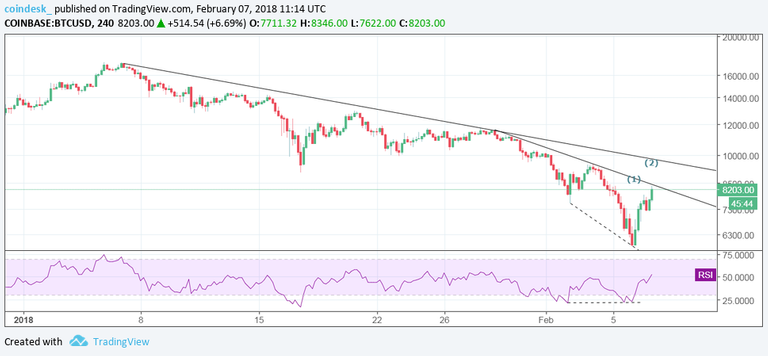
4-hour chart: Bullish price RSI divergence

A high volume recovery from $5,873 (previous day's low) and a positive follow-through today (break above the 200-day MA of $7,995) indicate the cryptocurrency may have bottomed out.
Further, the daily RSI is rising from the oversold territory and has breached the falling trendline, suggesting scope for further gains.

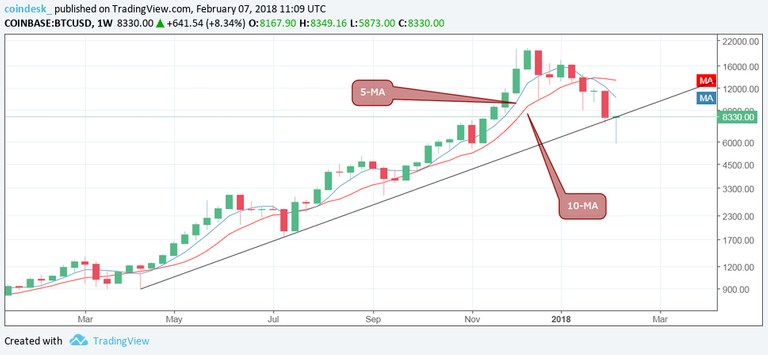
Weekly chart: Bearish MA crossover
The long-tailed candle indicates strong dip demand.
BTC is attempting a break above the trendline sloping upwards from the April 2017 low and July 2017 low.
The 5-MA and 10-MA bearish crossover (short-term MA cuts long-term MA from above) that occurred last month indicates that the long-run outlook still remains bearish.
View
BTC looks set to cut through the descending trendline hurdle (1) and rise towards the downward sloping 10-day MA currently seen at $8,925 in the next 24 hours.
A daily close (as per UTC) above the 10-day MA would open doors for a test of $10,000 – $10,623 (weekly 5-day MA). Further gains appear unlikely just yet, given the bearish crossover on the weekly chart.
Bear scenario: Failure to hold above the 10-day MA, followed by a close below the 200-day MA would revive the bearish outlook. In such a scenario, prices may drop to $5,000 levels.
▬▬▬▬▬▬▬▬▬▬▬▬▬▬▬▬▬▬▬▬
Thank for visiting my post!!
If you Like my post don't forget to leave some upvote and follow me @rankontop, and resteem this post thank you and more power to all steemit creator.
See you on my next post!!...
@rankontop
Source:
https://www.coindesk.com/floor-found-strong-volumes-push-bitcoin-above-8k/
I don't have Bitcoin, but thank God. It's pushing all the altcoins up.
Hi! I am a robot. I just upvoted you! I found similar content that readers might be interested in:
https://www.coindesk.com/floor-found-strong-volumes-push-bitcoin-above-8k/
Great insight and charts! I'm excited to see the volumes supporting the increase. I hope it continues to run to some through short term resistance as prior support was heavily there.