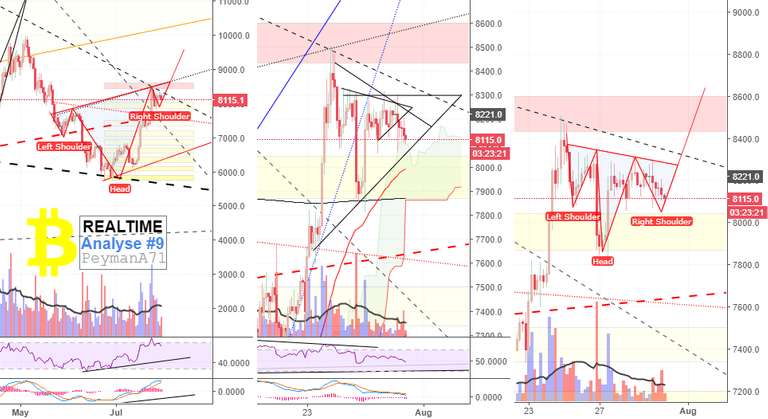
These are the moments we hate bitcoin -3.30% :), going sideways for 3 days in a row, dumping 200 points and going up just as fast again to repeat the cycle several times. I could see someone was loading up good amount of btc -3.30% the last hour. So even though the sell orders were quite big, someone was very willing and eager to catch those sell orders. The charts have not changed a bit since my last update, still just as ugly :). That inverse H&S is still in play, that big bull flag on the right is also still in play, price is still staying above it's support line, probably waiting for buyers to finally step in again and break through that 8300 level. I have been watching several this weekend what was going on with some of the attempts to break the 8300. The volume is just to low and i really had a feeling that the price was being pushed down, since it is very easy to do so with those low volumes. So of course it could mean 2 things, some is building up a short position, or it was just to early to let it rally and needed to get pushed down first to load up some long positions. These moments (sideways action with low volatility ) are the one that it's difficult for me to say what the next move will be. I think it's still more bullish than bearish for the coming week. Hopefully we will get our answer very soon.
So the 8100/8050 is a support level and the 8250/8300 is the resistance. I think if we break the 8300 we should see at least 8600/8650 before maybe making another correction again.
Sort: Trending