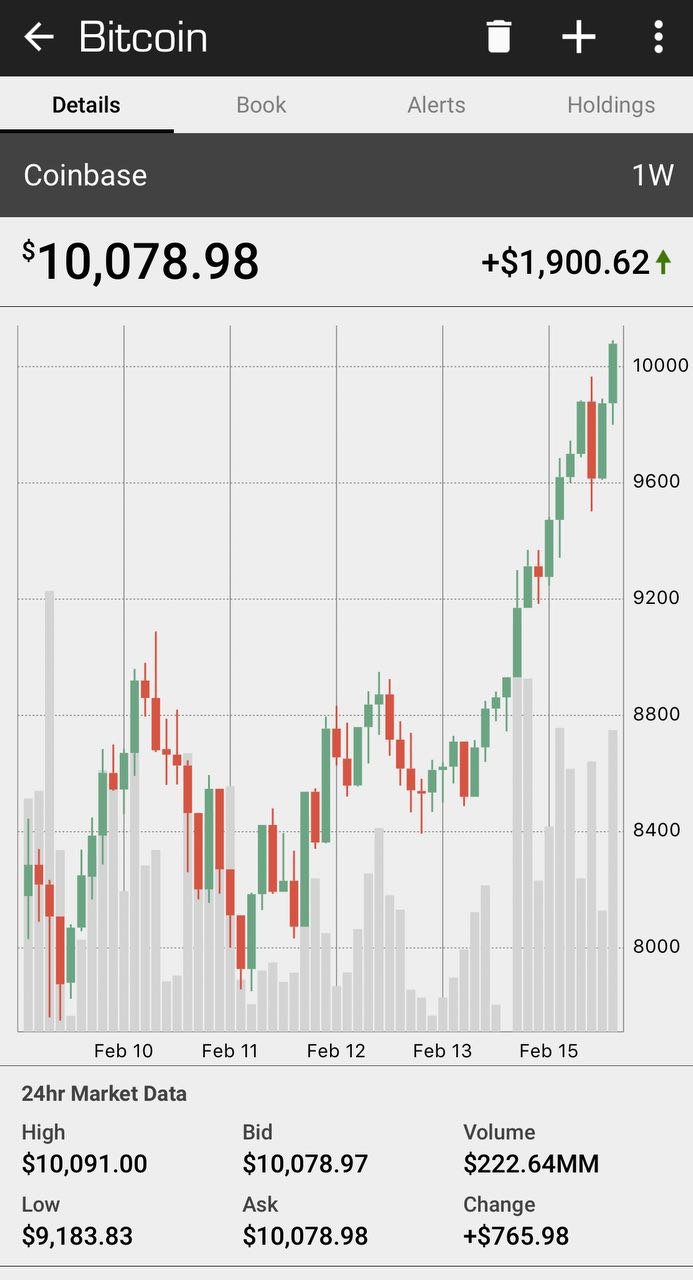
🎓 The above chart (prices as per Coinbase) shows:
BTC has moved above the resistance at $10081.48 (23.6 percent Fibonacci retracement of the sell-off from record highs).
Momentum studies: 5-day moving average (MA) and 10-day MA are curled up in favor of the bulls.
The relative strength index (RSI) is on the rise, indicating a potential for a further rally in prices.
So, BTC looks set to test $10,000 and may extend gains to $11,000 as suggested by the inverse head and shoulders breakout.
However, gains above $10,000 are to be viewed with caution, the weekly chart indicates.
photo source "www.bittrex.com"
Man it's still moving up fast! 11K by Friday would be great.
yes✌✌✌