BTCUSD - Day Traders Setup
Looking at Bitcoin USD with a day traders setup as this has been the principle mover, as per usual. With the recent break above 8k, BTCUSD set an all time high the 8200s and this will be our first target for a breakout, or breakdown. Of course, we lean bullish as this unstoppable train continues the rollercoaster ride - until it doesn't. If you are a trader and you are not using stop losses you will eventually get 'wrekt'. If you are an investor, by all means HODL this speculative position.
Moving averages:
Green = 50dma
Red = 200dma
Orange = 9ema
Black = 20ema

Daily
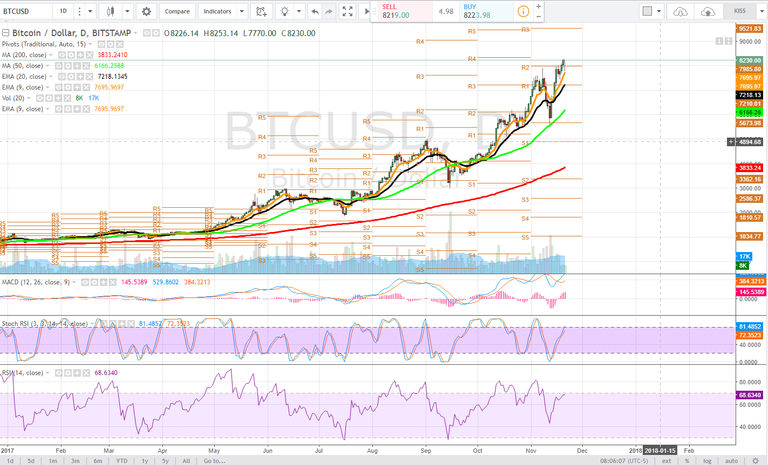
On the daily time frame, a steep overnight pullback saw the price drop rapidly nearly $400 in just a few hours before reversing sharply to the upside, bouncing off the 9ema. Crypto traders should be becoming more and more immune to such extreme price volatility.
The price briefly broke down below pivot R2 before quickly reclaiming it. $7985 is a key level for the bulls to hold. Now while the dollar difference seems huge compared to the current price, in percentage terms this is only 3%. So caution is still warranted as the price inst quite out of the woods yet.
Looking at the stochastic RSI we see it is only just reaching uptrend as the MACD has continued to power higher, now extending far above the zero line -- it can keep going as we look at the RSI which has not even entered overbought conditions from this rebound.
If the price fails to hold pivot r2 we look to the 9ema and then 20ema for support.

4 hour
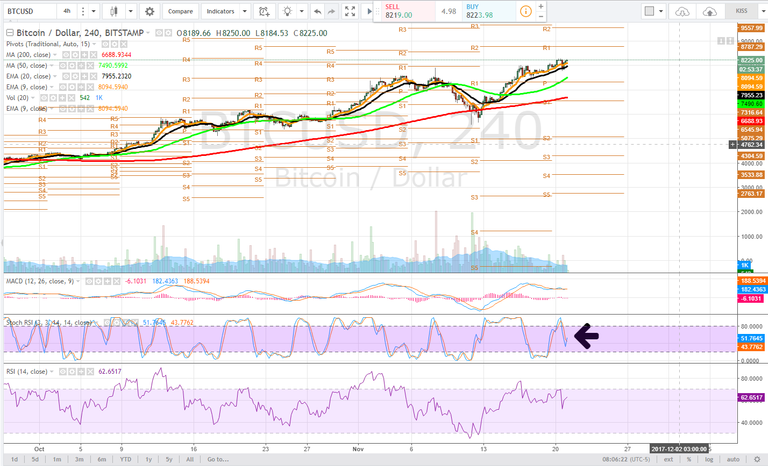
On the 4 hour time frame we see the stochastic SI has turned up sharply from the midground after descending with the steep pullback. There is lots of room for it to push higher and back into uptrend, which is what longer term traders are looking for - continued momentum.
During this pullback the price tested and bounced sharply off of the 20ema (black) approximately $7955 which aligns with pivot r2 on the daily time frame. We can see this is a significant level. The MACD has flattened its curve, and would need to see a continuation in volume to drive it into a decidedly bullish formation. The RSI as well is still yet to reach those overbought conditions during this rebound.
Bulls should be target pivot r1 on this time frame, $8787 as the next target to the upside. If the price fails to hold the 20ema, a test of the pivot is in the cards $7316. Again though these dollar amounts seem huge in difference when viewed in percentage terms they are relatively nominal and would be conducive to healthy price fluctuations.

1 hour
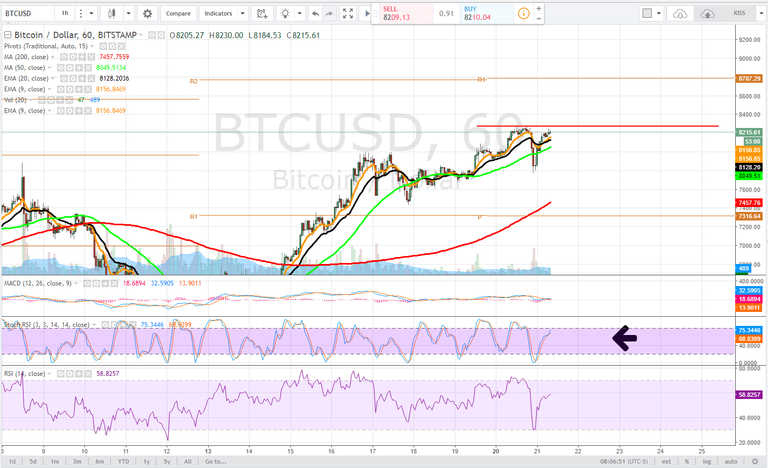
On the 1 hour time frame we see that a double top was set. This is our breakout target, approximately $8268.
A V bottom formed from the steep pullback and subsequent reversal with the 9ema crossing back above the 20ema. On the 1 hour time frame these are out nearest supports we would like to see hold. Support of last resort would be the 50dma green $8049. It is not unreasonable for the price to back test this range one more time. Bulls are simply looking to see the broader continuation of higher highs and higher lows, indicating the trend is still strong.
The stochastic RSI still has room to push into the uptrend range while the MACD produced a bullish cross. The RSI is in the midground and obviously, if the price sets a higher high above $8268 we would look for it to continue into the overbought range for our next run.
The price could consolidate here for a bit, producing a bull flag which would be a perfect formation to drive higher. The upside target is pivot r1 on this time frame $8787.

Bullish Above: $8275
Bearish Below: $8000
RISK TRADE: Scale a long position up to the 50dma on the 1 hour time frame, if the price fails to hold your stop loss should close you out and mitigate risk. Alternatively, enter heavy for a day trade on a print above the previous high.
Don't forget to use stop losses!!!
Previous Articles:
NEOUSD
DASHUSD
BTC Vs. BCH
BTCUSD
ETHUSD
BTCUSD
BCHUSD
BTCUSD
ZECUSD
XRPUSD
Follow at your own risk, Not a financial adviser, understand the risks associated with trading and investing. Manage your own Risk - in other words you could lose it all and it's your own fault.

BTC $10K Jan 2018 anyone? I just hate it when I'm waiting for that pull back that never happens :)
As soon as the CME goes live with futures trading, watch out! Mid December :)
I absolutely agree. And by the end of this year I think (it's just my personal opinion) bitcoin will reach $ 10K. The question I ask myself is... will it reach the 25K in march/april 2018? I'm optimistically it will. But bitcoin isn't everything. I hope some good altcoins will rise too.
Let's rock and roll then. BTC is still king, but as they always say, I am not a financial adviser. Lol. The future looks good for BTC to be honest.
Actually the opposite will happen, price will be smashed ;)
Bit late for that comment, hey... price fluctuations remain healthy, but by all means go short :-)
It amazed me..how u did this.. What would you say now? What is the actual trend?
the long term trend is up until we have a point of inflection on the weekly/monthly charts, could be some time. Even shorter term trend with all of the voaltility is up - higher highs, higher lows.
But why are there so many times fall-down? I mean heavy decrease...
Are they based on only fundamental news or there is something in the air?
No basis at all, its just price action, when ever we reach areas of supply and demand.
maybe there is any speculative thinking behind this, isnt??
Nothing goes straight up. The basis of technical analysis is analyzing statistics powering the price action and trying to make predictions based on probabilities.
Breakout or Breakdown? Don't trade until it's confirmed. Great Review of the chart.
you know how to do it! ... just broke out!
you taught me lol
Thanks for info. As always I'll use plus500 to follow your advice and open a long BTC/USD position. Great way to trade the price without having to use your BTC holdings :)
Good for you guys holding btc as for me I have alot on crypto trading. Just have only steem. Thanks for the analysis @ satchmo
Nic intresting i read .magar ukka jana samaj ni ai k akha hy to ha nal ha milai pai han
as per the chart so nicely explained and understand bitcoin reflection on price thank you Satchmo.
hi satchmo i m new on steemit i up votes
thnx
Bitcoin plummeted after Tether, a start-up company offering dollar-supported digital tokens, said its systems had been hacked and about $ 30.95 million of its chips had been stolen.
Bitcoin, which is known for its strong fluctuations, tends to bounce back quickly.
Bitcoin has grown more than 700% this year, with three separate corrections of more than 25%, all of which have given way to subsequent rallies. At current prices, bitcoin has a total market capitalization of approximately $ 134 billion.
Recent volatility came from a slight rise in investors who turned to alternative cryptocurrencies, including Bitcoin Cash, which pushed it to record highs.
too much fundamentals if you can call them that in crypto will cloud judgement. The freefall of BTC came before anybody saw anything in the network hash or price of BCH - moral of the story, PRICE LEADS
Till January 18, BTC must hit +10K .
i think before then. or just shy of it EOY - in JAN i think higher than 10k followed up by a retrace.
Yes day by day it will increase. You can find more about it https://steemit.com/money/@smarifulislam/1-btc-as-high-as-usd196-165
Nice picter
Everyday another ATH.. It will reach 100K$ soon! lol
id be okay with that :P
I guess BTC raise more next month.
SATCHMOOOOOO