I believe that it is possible to beat the market through a consistent and unemotional approach. This is primarily achieved through preparing instead of reacting. Click here to learn more about the indicators I use below and click here from my comprehensive trading strategy. Please be advised that I swing trade and will often hold onto a position for > 1 month. What you do with your $ is your business, what I do with my $ is my business.

My most recent Bitcoin Bubble Comparison led to the following predictions: 1 day - 28 days = < $5,750 | bottom prediction: $2,860 by 10/30
Previous analysis / position: “This bounce should provide a good opportunity to build a short, if you are not already in one. There is major resistance from $6,375 - $6,667” / Short ETH:BTC from 0.03143 | Short ETH:USD from $211.96 | Short EOS:ETH from 0.0252326
Patterns: Descending Triangle, head and shoulders
Horizontal support and resistance: S: $6,233 - $6,250 | R: $6,350
BTCUSDSHORTS: Pulled back yesterday and appear to be taking off again.
Funding Rates: Longs pay shorts 0.0055%
12 & 26 EMA’s (calculate % difference): 12 = -2.81% | 26 = -4.74%
50 & 128 MA’s: 50 = -6.05% | 128 = -10.08%
Volume: Big hourly volume on sell off
FIB’s: 0.786 = $6,377 | 0.886 = $6,248 | 1.618 = $5,330
Candlestick analysis:
Ichimoku Cloud: 4h cloud continues to act as resistance
TD Sequential: 4h doji indicates incoming volatility
Visible Range: Testing point of control with 1m - 12m lookback
BTC Price Spreadsheet: 12h = +0.94% | 24h = +1.73% | 1w = +1.32% | 2w = -0.77% | 1m = +0.12%
Bollinger Bands: Last spike retested MA
Trendline: Trendline I drew yesterday was holding strong, last rally broke through it.
Daily Trend: Bullish
Fractals: Up has $6,555 did not break on last pump (yet) | Down at $6,050
On Balance Volume: Starting to move up faster than price on daily
ADX: Still indicates trendless market
Chaikin Money Flow: Bear div’ on daily
RSI (30 setting): Weekly = 48.84Daily = 46.18
Stoch: Re crossed bullish on daily
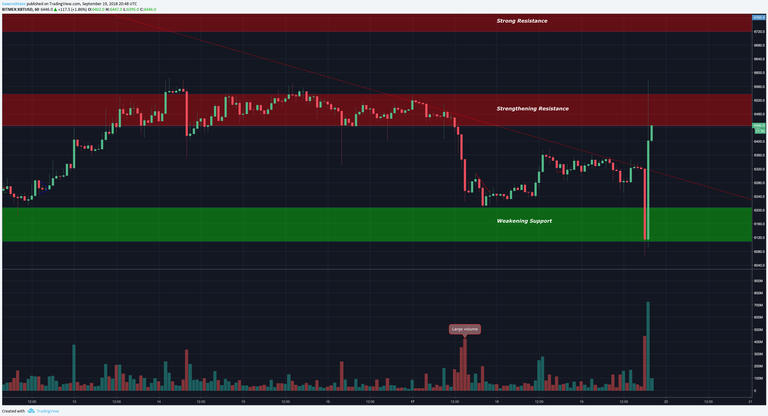
Summary: Buckle up your seat belts and get ready for some volatility! If you have forgotten how hard and fast these markets can move then this morning was a bit of a wake up call. Last week I said that I wanted to see a quick spike up to $6,700 in the form of a short squeeze to act as a shakeout before the breakdown.
The pump briefly broke through the horizontal resistance line that I have been watching for two weeks. However it quickly pulled back down and formed a nasty wick on the 1 hour chart. Now I am watching for the price to re explore that wick before continuing the down trend.
These wicks being re explored can often provide low risk entries. I like to set sell orders around the halfway to three quarter market of the wick, in this case that would be $6,490 - $6,525 and I place the stop loss slightly above the top of the wick ($6,601).
As usual I would strongly prefer to short ETH due to how much weaker it has been at every step of the way.
I also have an order set to short EOS:BTC at 0.0007474. Click here to read that analysis.
Thanks for reading!

Allow me to Reintroduce Myself...
Learn How to Trade! [part 1]
Learn How to Trade! [part 2]
Wyckoff Distribution
Bitcoin Bubble Comparison
The Most Overvalued Coin in Crypto: EOS
Bitcoin Daily Update (day 201)
Coins mentioned in post: