I believe that it is possible to beat the market through a consistent and unemotional approach. This is primarily achieved through preparing instead of reacting. Click here to learn more about the indicators I use below and click here from my comprehensive trading strategy. Please be advised that I swing trade and will often hold onto a position for > 1 month. What you do with your $ is your business, what I do with my $ is my business.

My most recent Bitcoin Bubble Comparison led to the following predictions: 1 day - 28 days = < $5,750 | bottom prediction: $2,860 by 10/30
Previous analysis / position: “Keep an eye on the daily candle. If it closes below $6,392 then it would create a shooting star and that could be a good time to enter.” / Stops trigger on ETH shorts, currently on sidelines.
Patterns: Descending triangle
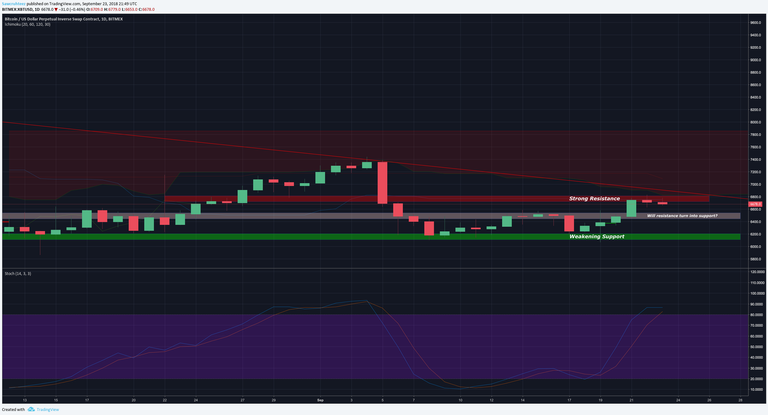
Horizontal support and resistance: R: $6,800 | S: $6,650 / will it retest $6,550 for support?
BTCUSDSHORTS: Pulling back from triple top, should return to 25,000
Funding Rates: Longs pay shorts 0.01%
12 & 26 EMA’s (calculate % difference): 12: +2.8% | 26: +1.61% | Posturing for bullish crossover
50 & 128 MA’s: 50: +1.67% | 128: -3.06 (represents critical resistance
Volume: Unimpressed by volume behind current pump.
FIB’s: 0.618: $6,611 | 0.5: $6,763 | 0.382: $6,916
Candlestick analysis: Price pulling back from daily doji. Bullish wick on weekly.
Ichimoku Cloud: 1hr cloud is thick and currently acting as support. If it re enters cloud then expect it to retest $6,445. The daily cloud is thick and will be acting as resistance at $6,800. If the price closes inside the cloud then expect a $7,900 retest.
TD Sequential: G2 briefly trade above G1, looks like it was a trap. Weekly on fourth consecutive price flip. 4h is currently on a R3.
Visible Range: Back above the point of control with 2m - 1y lookback.
BTC Price Spreadsheet: 12h: -0.65% | 24h: -0.74% | 1w: +2.57% | 2w: +5.43% | 1m: +4.19%
Bollinger Bands: Top band is at $7,017 and is expected to be retested after breaking through MA. Weekly MA currently acting as resistance.
Trendline: Top of descending triangle = $7,000 - $7,100
Daily Trend: Chop, favoring the bears
Fractals: Broken up fractal, and new down at $6,106 | Next up = $7,390
On Balance Volume: Massive bull div on weekly.
ADX: Trendless market
Chaikin Money Flow: Bear div on daily.
RSI (30 setting): D: 49.47 | W: 51.22
Stoch: Turning down for a slight bear div on weekly. Overbought on the daily.
Summary: The price of Bitcoin is currently trading at critical levels of resistance. We are approaching the top end of the descending triangle and it will be accompanied by a cluster of resistance from the: 128 day MA, daily Ichimoku Cloud, daily Bollinger Band, weekly Bollinger Band MA, and $6,800 horizontal resistance. Furthermore the daily stochastic is overbought and posturing for a sell signal.
On the other hand, the bulls have some strong indicators for a continued rally themselves. The divergence is the weekly OBV is very significant and cannot be ignored. A couple closes above the 50 day MA is also very significant. If the price can re enter the cloud and then breakthrough the triangle on high volume then this bear market could end much sooner than I expected.
I am going to continue to wait on the sidelines for further development. I will be watching for the price to retest prior resistance for support at $6,560 and see what happens from there. Will it go on to create a higher high and retest the top end of the triangle, or will it breakdown without providing a bounce?
Right now it can be easy to turn bullish and start looking for long entries. I think that is still very premature and could cause you to miss out on some great shorting opportunities. I will not turn bullish until the price breaks out of the descending triangle (on volume), creates a higher high above $7,400 and breaks through the daily Ichimoku Cloud. Until all of those boxes are checked I will continue to look for bearish entries.
Thanks for reading!

Allow me to Reintroduce Myself...
Learn How to Trade! [part 1]
Learn How to Trade! [part 2]
Wyckoff Distribution
Bitcoin Bubble Comparison
The Most Overvalued Coin in Crypto: EOS
Bitcoin Daily Update (day 204)
Coins mentioned in post: