Disclaimer: This is not meant as financial advice and is for entertainment purposes only.
Yesterday we took a look at the short sellers on Bitfinex in relation to the price of Bitcoin. I noted that the shorts had fallen drastically while the price of BTC remained flat. That told me that the only buyers at this level are short sellers who are covering or getting liquidated.
I predicted the shorts to continue to fall to 22,765 before a sharp reversal. That is where I expected the shorts to pick back up and the price of Bitcoin to fall back down.
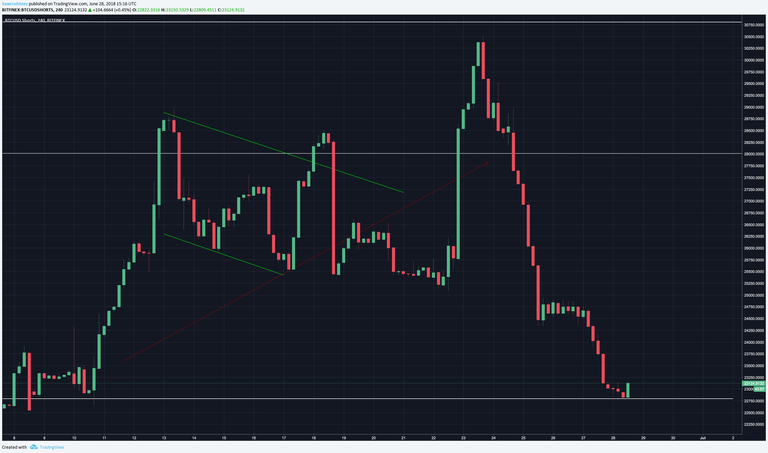
The momentum appears to be reversing at 22,800. With how sharply the short sellers have fallen off in the past 48 hours I really would have expected to see the price of Bitcoin rise. Instead it has fallen itself.
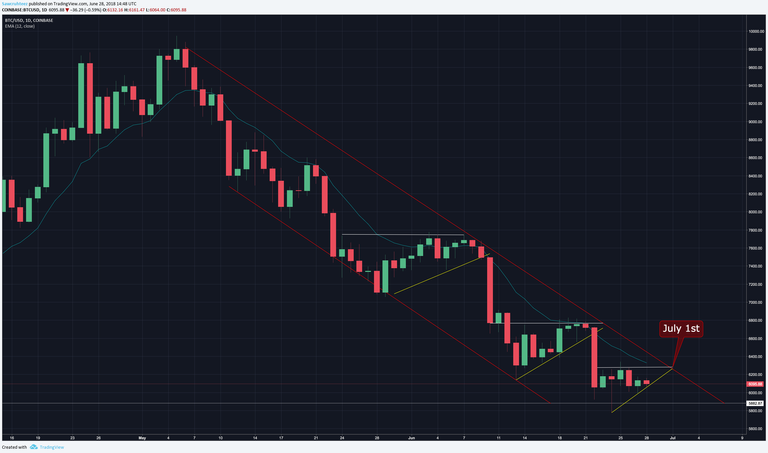
I am taking that as a very bearish indication. Once the short sellers are on the rise again it will almost certainly push the price down. I am expecting a breakdown of $5,900 support by 7/1. That is based on the cluster of resistance from the trendline (red), prior support turned into resistance (white) and the 12 period EMA on the daily chart (teal).
The short term EMA's (12 & 26) have a bearish crossover on the following timeframes: 15m, 30m, 1h, 2h, 4h, 6h, 12h, 1d, 3d, 1w.
It is often best to wait for all of the time frames to paint the same picture before making an entry. That is currently the case with the moving average crossovers and I have found that to be one of my most reliable indicators.
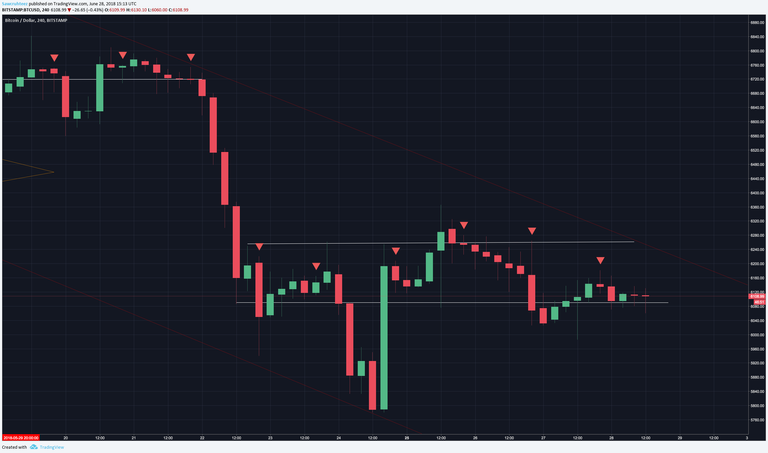
The price has been stuck in a range over the past week from $6,100 - $6,300. Once we get a move outside of that zone I am expecting a big move. If you are not currently in a position then opening a small short at the current price and added to it upon a breakdown of $6,100 should work out nicely.
If you have the ability to short alts vs USD or BTC that should be the best bet. I am currently short BTC:USD, ETH:USD, and ETH:BTC.
The stop loss and profits targets are as follows:
BTC
Stop: $6,876
Target: $4,950
ETH
Stop: $556
Target: $360
Stop losses are based on the most recent Bill Williams Fractal from the daily chart . Profit targets are based on trendlines , prior support and FIB retracement levels.
Thank you for reading! Have something to say? Leave a comment! Click the follow so that you don’t miss out on future updates and remember that smashing the like is good karma!

After content like that you know you want more!
Yesterday's Post - Day 122
Trading Challenge - Day 109
Weekly Gold Update - Week 15
School - Intermediate Trading Strategy | Gold Weekly Update (week 13) | White Paper Cliff Notes: AION | Intro to Indicators: Stochastic | Bitcoin Market Cycle
Need a break? Read some Poetry! - I Believe | Aliens | The Universe is a Hologram | Sunset
Nice analysis, thanks.
Hi! I upvoted your post, can you guys upvote my post please? It seems impossible to get anywhere since I am new here, my post just drowned in the sea of posts.
Upvote it only if you think its worthy!
oXm
i also wanna do likE thaT