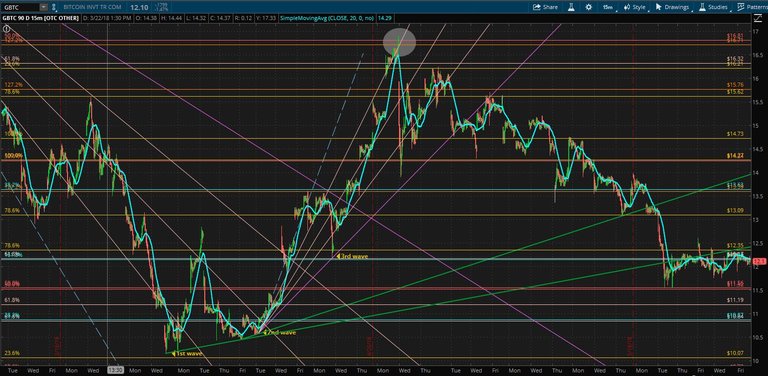
I am going to use Fibonacci to look at the price trend of bitcoin trust fund. Fibo extension and Fibo fan to use. This is 1 year chart of GBTC
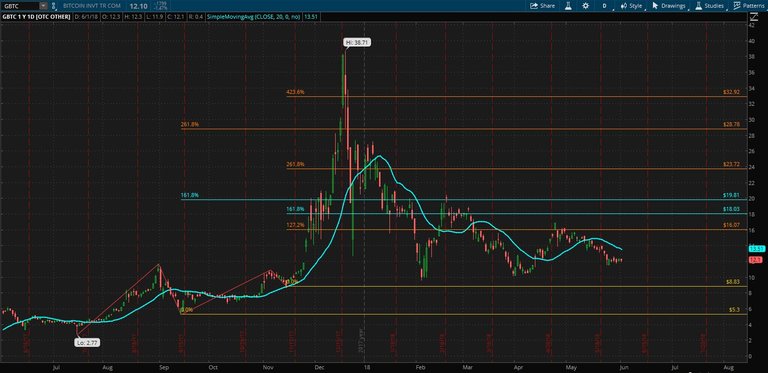
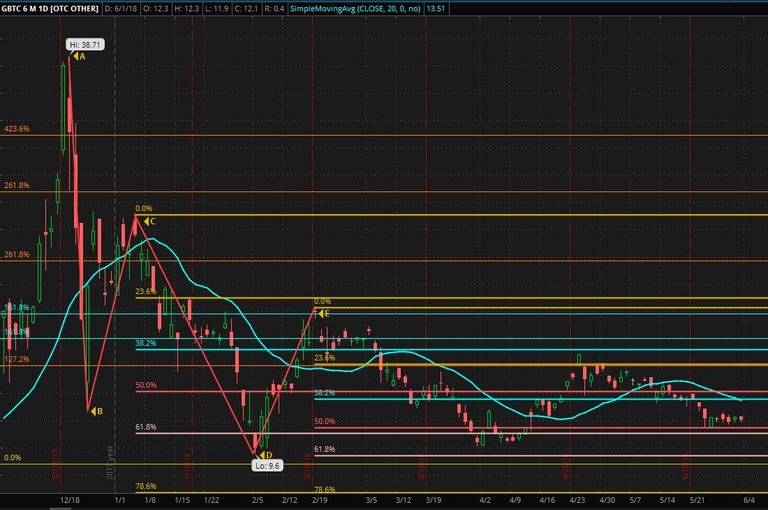
First, A-B-C-D-E was connected to generate Reverse Fibo extension. Because it is a decline.
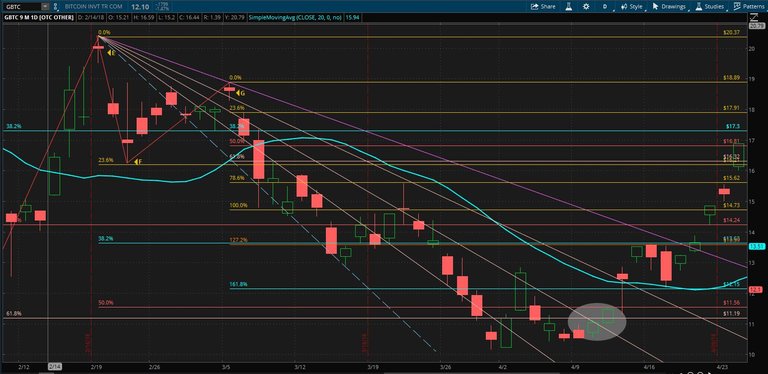
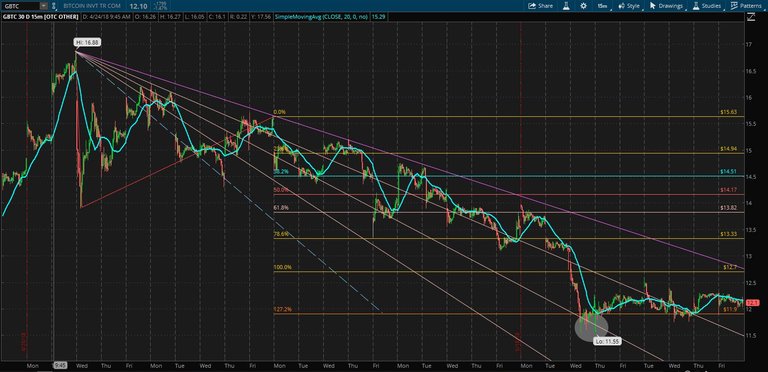
Next, to find any possible bottom price, I created one more reverse Fibo extension connecting E-F-G and draw a Fibo fan connecting E-G.
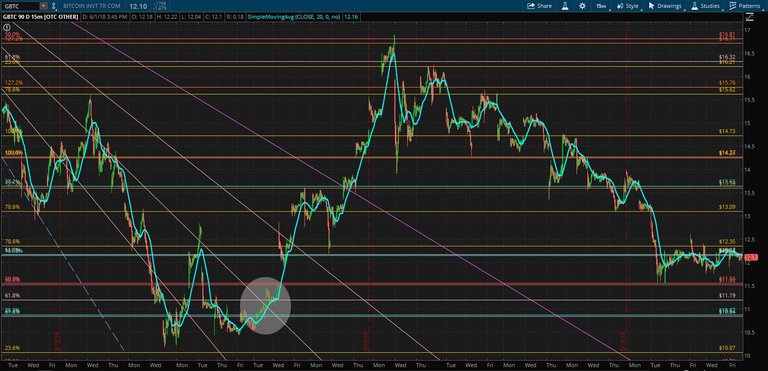
The bottom value is more clearly seen on the 15 min chart. Above all, it takes priority to break through the SMA 20 line upwards.
The fact that this climbed well from the floor and then dropped again at 16.81 would be understood as an correction to overbought due to three-stage wave. Additionally, as you can see from the first picture, it broke upward 127.20% level(16.71), but it can be said that there was no support by SMA20.
I have already drawn only the fan for the 3rd wave because the picture is already complicated enough.
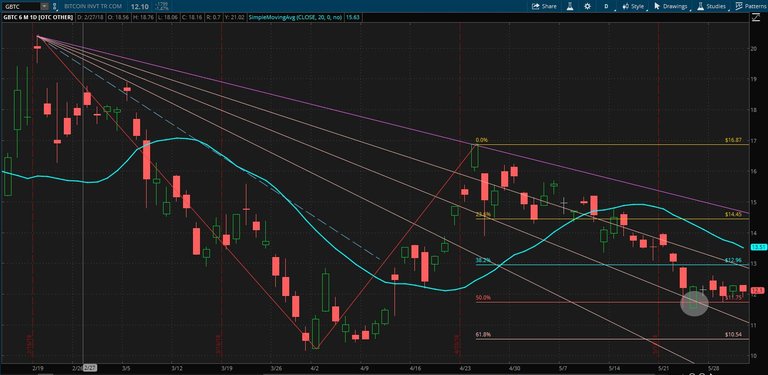
To find the floor value again, you can use various time frame charts. Here is an example using 1 day interval and 15 min interval chart.
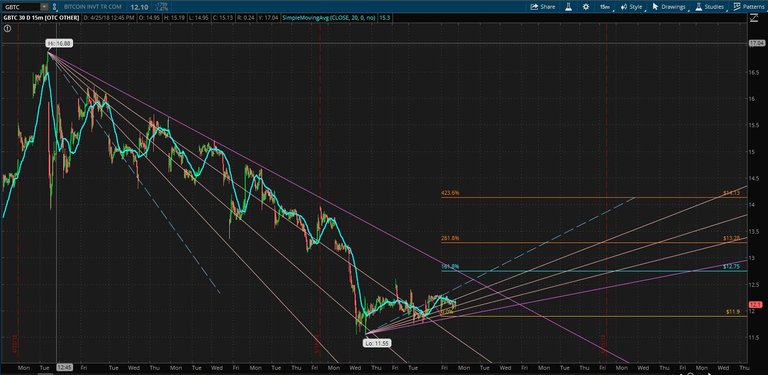
Now I am talking about the conclusion. 11.90 is the main support number. If trend will not break down the purple line, which is the main support line in the upright Fibo fan, it will progress to the level of 12.75 (161.80%) and if this break through the upward with the help of SMA20 curve, this can reach next price range 13.28 or 14.13.
Thank you for reading. This is my first posting and hopefully help this explanation how Fibo extension and Fibo fan can help chart analysis.
Legal Disclaimer :
I am not a qualified investment advisor, all information found here, including any ideas, opinions, views, predictions, forecasts, commentaries, suggestions, or stock picks, expressed or implied herein, are for informational, entertainment or educational purposes only. The numbers in chart may be inaccurate because there is an error in plotting the chart.
Please give me a follow and I will give you a follow in return!
Please also take a moment to read this post regarding bad behavior on Steemit.✅ @sceaux, I gave you an upvote on your first post!