Note: This column is changing to examine three time periods: the 4-hour, daily, and weekly charts. Also, the moving averages used in the double moving average system are changing to the 12 EMA and 26 EMA. In the future, I plan to write more about this system. For now, I find these moving averages to be very informative, especially when combined with multiple time frame analysis.
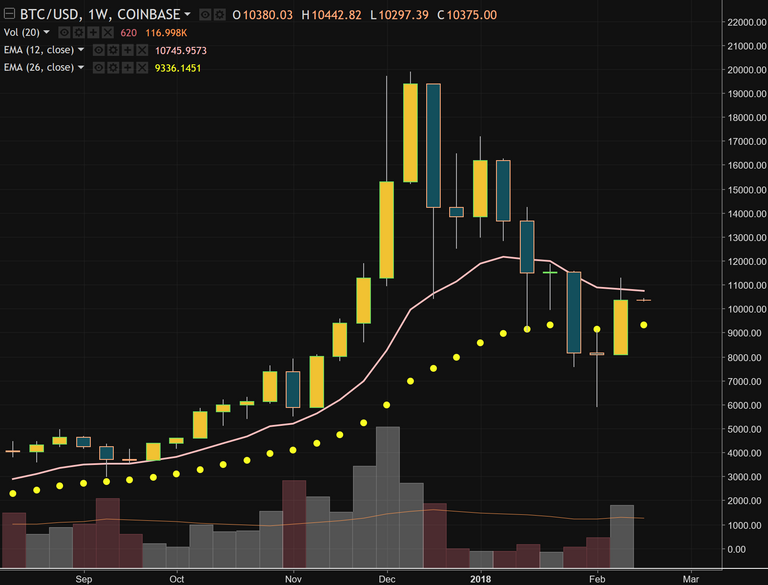
Bitcoin's rally from $5,900 has stalled near $11,000. BTCUSD looks to figure out its next direction. The weekly 12 EMA has capped the rally, and the Bitcoin price will need to close above $10,750 on a weekly basis to continue its recovery.
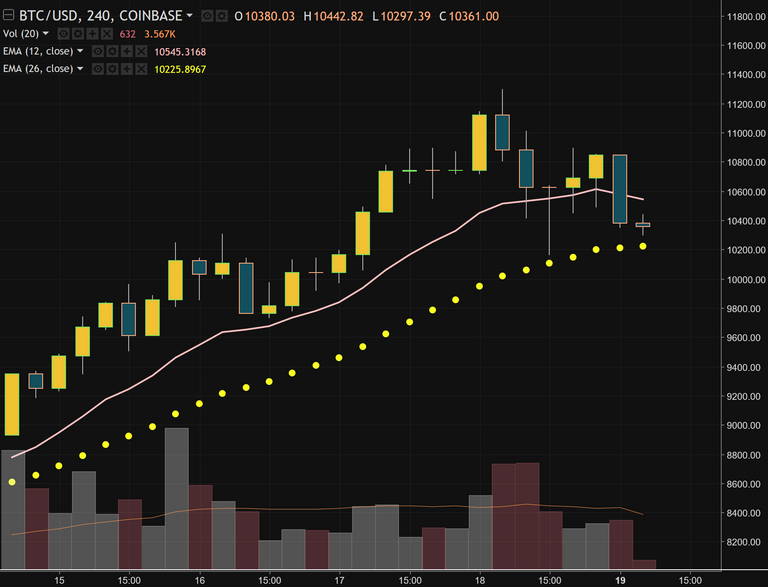
4-Hour Chart
12 EMA: $10,545
26 SMA: $10,225
The 4-hour chart remains bullish but possibly overextended. Bitcoin now trades in between the 12 EMA and 26 EMA. Look for a break above the 12 EMA to confirm continued bullish action, and a break below the 26 EMA to signal a trend reversal.
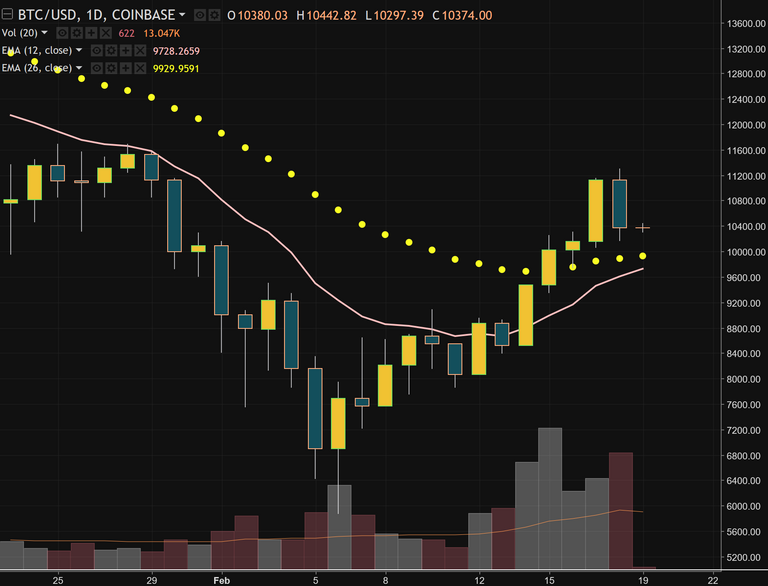
Daily Chart
12 EMA: $9,730
26 SMA: $9,930
On a daily basis, Bitcoin remains strong. BTCUSD trades above both its 12 EMA and 26 EMA, and those two moving averages now provide support for the price. The faster 12 EMA still trades below the slower 26 EMA, and until a bullish moving average crossover happens, a risk to the downside remains.
Weekly Chart
12 EMA: $10,745
26 SMA: $9,335
The weekly chart gives the most pause because Bitcoin was last week unable to close above its 12 EMA at $10,745. Until BTCUSD can stabilize above this moving average on a weekly basis, a bearish bias will persist.
DISCLAIMER
This post is for information and illustrative purposes only. It is not, and should not be regarded as “investment advice” or as a “recommendation” regarding a course of action.
DONATE
Bitcoin: 19498NLGwLbzN7yKrNbYqc4wuwZPkTGMVD
Ethereum: 0x76F2D78c81C6C97473DaF2aa3219F78Ce8C5A92f
Litecoin: LNhKXYTC5t2ZxcKYfo3pMzk8QsjZXsEbgT
CONTACT
twitter: sjanderson144
instagram: sjanderson144


Coins mentioned in post: