Bitcoin rallied overnight and has settled above $9,000. The 4-hour chart made a "bullish moving average crossover" for the first time since early January 2018. BTCUSD now targets the daily 34 EMA near $10,000.
Daily Chart
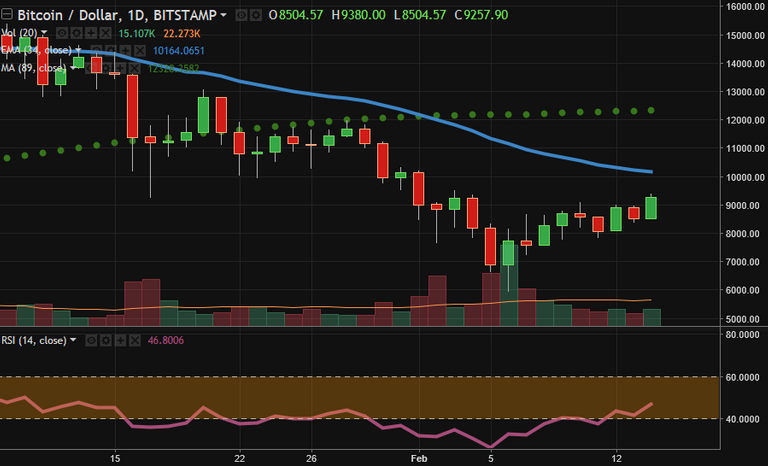
34 EMA: $10,165
89 SMA: $12,330
The daily chart still is in bear mode. The 34 EMA is valued below the 89 SMA, and the Bitcoin price is lower than both moving averages. However, the price has bounced from the $6,000 level and is moving higher. The rally could pause near the 34 EMA at $10,000.
4-Hour Chart
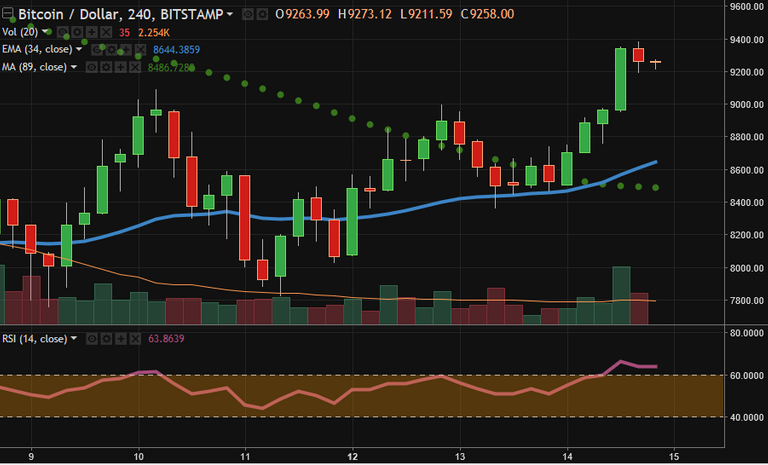
34 EMA: $8,645
89 SMA: $8,485
The 4-hour chart has turned bullish, making a "bullish moving average crossover" last night. Bitcoin currently trades near $9,200, above both its moving averages which now become support. Look for the 34 EMA, currently at $8,645 and rising, to stop pullbacks.
DISCLAIMER
This post is for information and illustrative purposes only. It is not, and should not be regarded as “investment advice” or as a “recommendation” regarding a course of action.
DONATE
Bitcoin: 19498NLGwLbzN7yKrNbYqc4wuwZPkTGMVD
Ethereum: 0x76F2D78c81C6C97473DaF2aa3219F78Ce8C5A92f
Litecoin: LNhKXYTC5t2ZxcKYfo3pMzk8QsjZXsEbgT
CONTACT
twitter: sjanderson144
instagram: sjanderson144