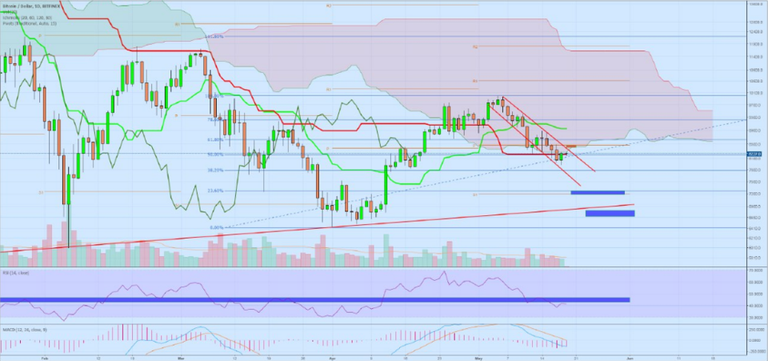
- Khung 1D chúng ta có mô hình nến teweeze bottom báo hiệu đảo chiều đi lên tuy nhiên volume ko thực sự thuyết phục, bên cạnh đó giá sau khi đc KJ kéo lên nhưng vẫn nằm ngoài đám mây, RSI mất đà tăng tại vùng 40-45 đang tiến về vùng 30.
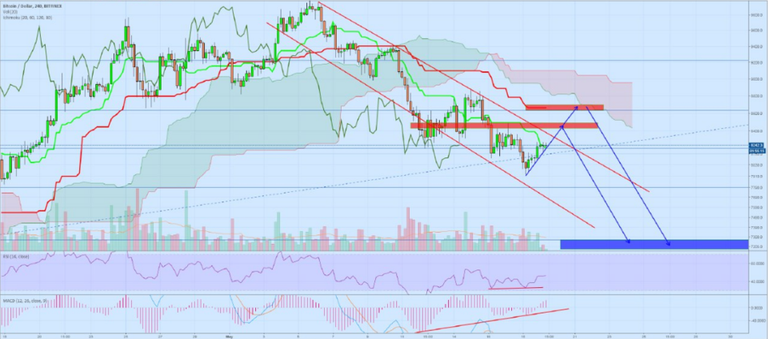
Khung 4H: xuất hiện bull div cả RSI và MACD nhưng yếu nên khả năng có sóng hồi lên đến 2 vùng kháng cự cần quan tâm là: $8400 và $8600.
Dự đoán hướng đi của BTC trong những ngày tới, như sau:
- The 1D frame has a teweeze bottom candlestick pattern that signals a reversal but the volume is not really convincing. Besides the price that KJ pulled up but still out of the cloud, the RSI lost momentum at 40 -45 is heading towards 30.
Frame 4H: bull div in both RSI and MACD is appearing but weak, so the probability of rebounding to 2 areas of resistance is: $ 8400 and $ 8600.
Predict the direction of BTC in the coming days, as follows:
Information is a personal opinion to decide for yourself.


woa igree for info,but bitcoin is downtrends
khó hiểu quá hi