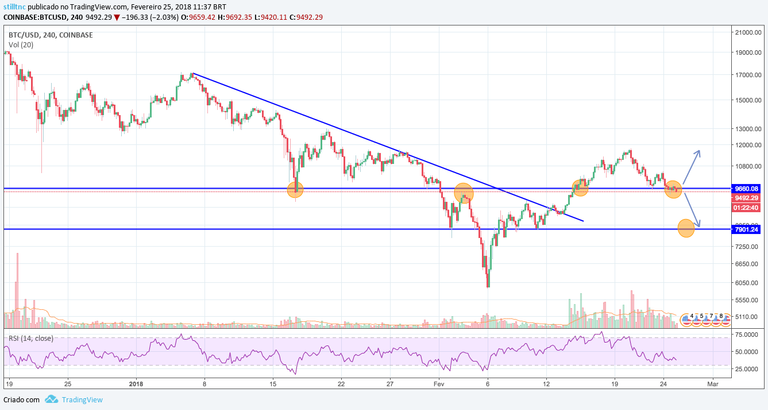
In the first post that I made Bitcoin chart, I told about the resistence around $ 9,300 - $9,600. BTC has passed this resistence on February 15.
Now, days after this movement, we are testing this level again, but as a support, like as shown in the chart. So, Bitcoin has two possible ways; comeback to next support around $ 7,900 or test the resistence on $ 11,775.
Looking at the volume, decreasing in the fall price, and the RSI tool, below 35, I believe the most likely movement is come back to $11k level.
I'll keep you updated.
Obs.: Do not take any material or analysis in this blog as a recommendation. It's just my opinion and this is not a financial advice.
Hello @stilltnc,
Do you think BTC will go down below $9300 today?
Today, I don’t think so... maybe this week if the bearish strenght continue.
Thanks for your quick reply! The price is now $9600, looks like the bear is losing now.