bitcoin price another encounted another blow when coin base CEO armstrong warned that it may take longer for mass adoption .
This technology shows that from bubble and correction.
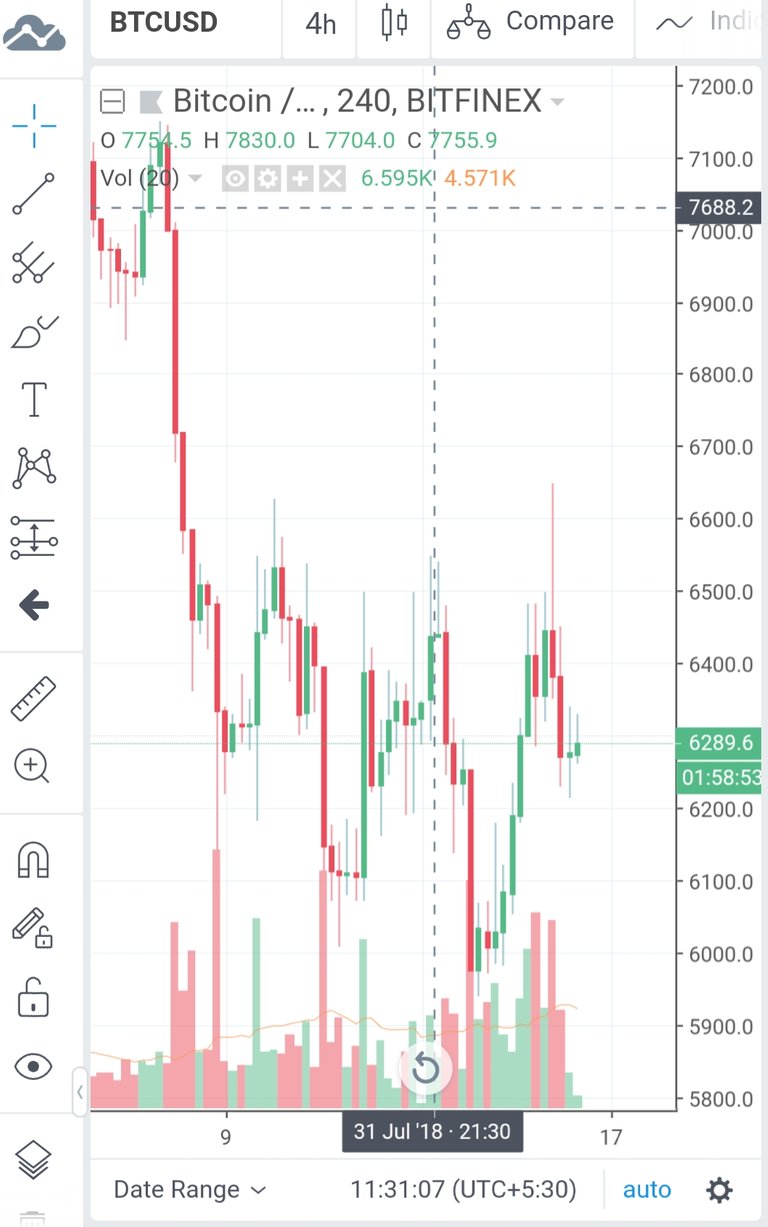
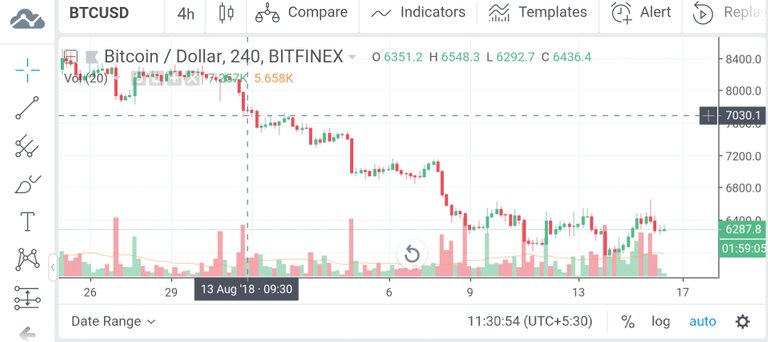
In previously shows that bitcoin price trading range previously $5782 to $6510. And intraday low was $6212 and high was $6647.
This is situation shows as per february and june and it is ambigious bear was trying to break level $6000. And buyer accumulating arrounf $6000.
4H chart is showing that, bull is likely to resistance arround $6650 to $6680. Bear are trying to defend downtrend line and moving average.
Failure to beat $6680 to $6039 and we have doubt that it will held and losses $5782 to $5350.
stochastic shows selling pressure and RSI shows some selling pressure left.
Breaking $6039 that tend to test $5782 and break that goes to test $5300 -$5500.
reaching $6680 and holding above it will stop the decline.

support level 1st is $6039.
resistance level 1st is $6680.
support level 2nd is $5782.
resistance level 2nd is $6964.
Expected trading today between $5782 to $6680.
Expected trend is bearish today
Thats all
Have a nice day
If you have any querry comment me.
If you like post UPVOTE it and RESTEEM it.