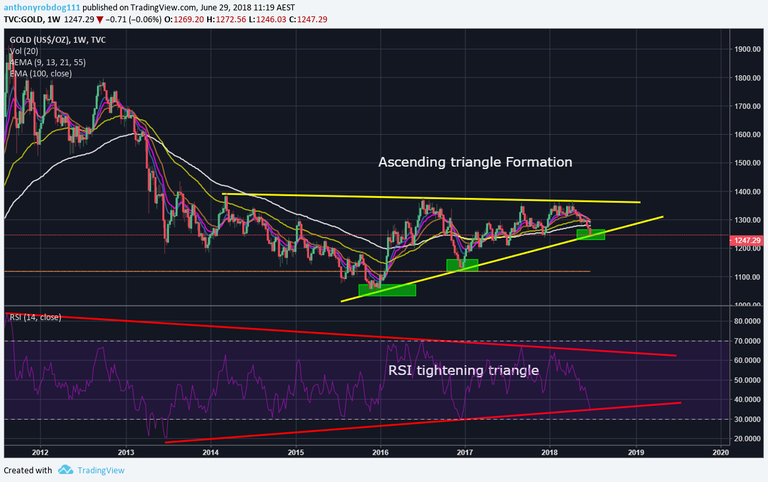
This post only considers the technicals related to gold price, I believe for any investment/long term trade many hours must be put into fundamentally analysing the economic climate, cycles and other asset classes.
Gold has been forming a BULLISH ascending triangle on the weekly chart with no breaks through the bottom trend line. This indicates the the bulls are gaining strength comparative to the bears. Additionally there is a strong region of support within the highlighted green box. If price action bounces off the current trend line and continues in an upward trend this would be an extremely bullish signal, as upon breakout gold would likely reach new all times highs.
 \
\
How to play ascending triangles, (basic summary).
After the ascending triangle has made a clear formation there are two key areas in which trades can be made, these are at the base trend line, and upon breakout of the horizontal trend line.
At the red box I would consider selling some or all of my holdings, as there may be another down tick within the triangle. Upon confirmation of a breakout through candlestick analysis, I would then reenter a position and then look for my next profit taking regions. I use tight stop losses (1200).

Now, what is the likely profit taking regions upon break out.
Based on fib extensions and previous price action, these are likely profit taking regions

Congratulations @technicalanthony! You received a personal award!
Click here to view your Board
Congratulations @technicalanthony! You received a personal award!
You can view your badges on your Steem Board and compare to others on the Steem Ranking
Vote for @Steemitboard as a witness to get one more award and increased upvotes!