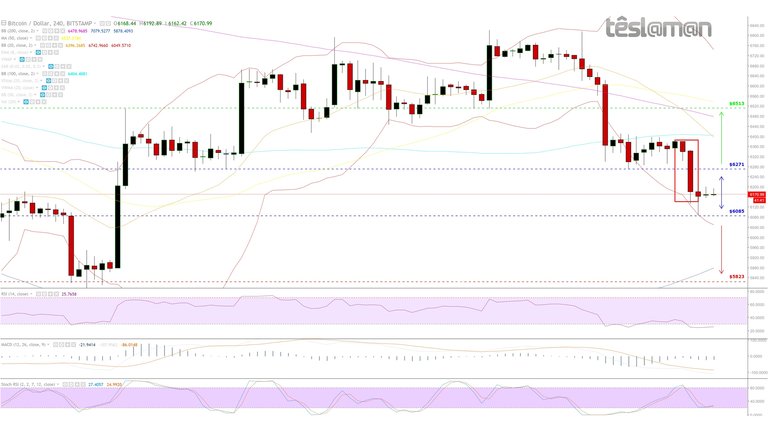
4H Chart - Price Key Points:
- 20MA crossed under 50MA and 200MA.
- Riding downwards the 20MA lower bollinger band.
- Fair support at approx $6047.
- 100MA resistance at approx $6404.
- Indicators still attempting to find a bottom.
- Stockastic RSI with a positive divergence.
- Positive volume low.
- Temp weakness might persist.

Possible Scenarios (adjusted) :
Long: On a confirmed break above $6271 – Price Target $6513 | Probability: 35% | Signal Strength: 3/5
Neutral: Price Range $6085 - $6271
Short: On a confirmed break below $6085 – Price Target $5823 | Probability: 38% | Signal Strength: 4/5
Our Stance: Careful with shorts.
Hello @teslaman are sure Bitcoin price down at $5823?
If $6085 doesn't hold possibilities will increase.