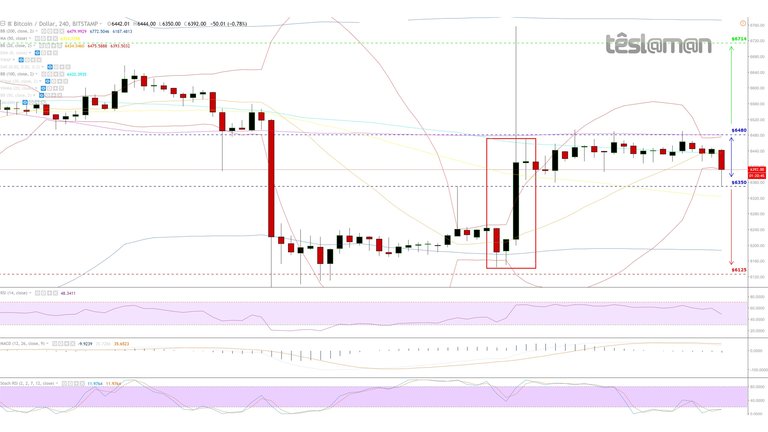
4H Chart - Price Key Points:
- 20MA Bollinger bands extremely narrow.
- 200MA resistance at approx $6480.
- RSI and MACD slightly negative.
- Stochastic RSI extending to a possible bottoming process.
- Models suggest a bit more consolidation.

Possible Scenarios (unchanged):
Long: On a confirmed break above $6480 – Price Target $6714 | Probability: 40% | Signal Strength: 5/5
Neutral: Price Range $6350 - $6480
Short: On a confirmed break below $6350 – Price Target $6125 | Probability: 36% | Signal Strength: 3/5
Our Stance: Neutral to very tight speculative long.
How do you think @teslaman what will happen next?